The Console Monitor in Workspace ONE UEM is your central portal for fast access to critical information. With its colorful bar and donut graphs, you can quickly identify important issues and act from a single location.
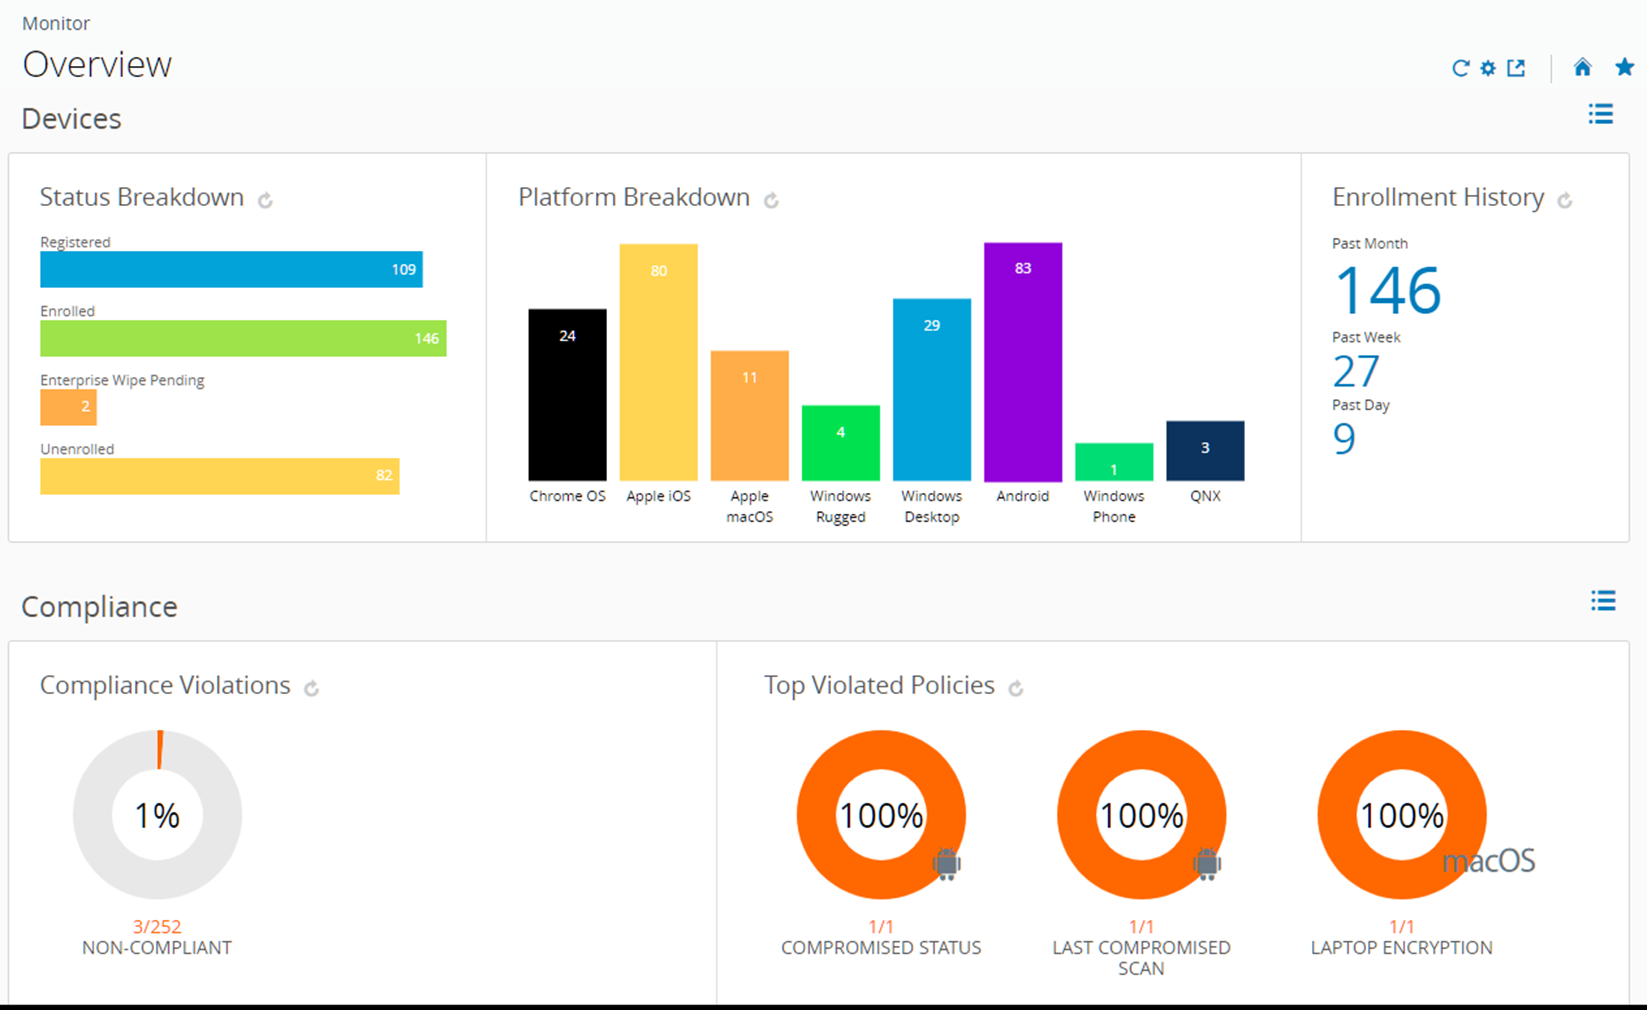
Selecting any bar or donut graph on the page displays the Device List View. This list view contains all the devices specific to the metric you selected. You can then perform actions such as sending a message to those devices.
For example, select the Antivirus Status donut graph. Within seconds, the Device List View displays with a list of devices whose lack of antivirus software has triggered a policy violation. Select all the devices in this list by clicking the check box to the far left of each device. You can also select the "select all" check box below the Add Device button. The action button cluster displays above the listing. Select the Send button to send a message to the users of the selected devices. You can select an Email, a push notification, or an SMS text message.
The Monitor > Monitoring Dashboard page provides summary graphs and detailed views.
-
Devices – View the exact number of devices.
- Status breakdown of all devices including registered, enrolled, enterprise wipe pending, device wipe pending and unenrolled.
- Platform breakdown of devices enrolled in Workspace ONE UEM.
- Enrollment history over the past day, past week, and past month.
-
Compliance – View which devices are violating compliance policies.
- All compliance policies currently violated by devices, including apps, security settings, geolocation, and more.
- Top violated policies, covering all types of compliance policies established.
- Denylisted Apps, including all denylisted apps installed on devices, ranked by order of instances of violation.
- Devices lacking the apps that you want to be installed and ready for your users.
-
Profiles – View which profiles are out of date.
- Latest Profile Version, including devices with old versions of each profile.
-
Apps – View which applications are associated with devices.
- Latest Application Version, including devices with old versions of each application.
- Most Installed Apps, ranked by devices that have the application currently installed.
For more information see, Tracking and Monitoring Your Application Deployment.
-
Content – View devices with content that is out of date.
- Latest Content Version, including each file that is out of date ranked by order of instance.
-
Email – View devices that are currently unable to receive email.
- Devices Blocked from email, including devices blocked by default, denylisted or unenrolled.
-
Certificates – View which certificates are set to expire.
- Certificates expiring within one month, one to three months, three to six months, six to 12 months and greater than 12 months. Also, view certificates that have already expired.
The set of devices shown varies depending on your current organization group, including all devices in child organization groups. Switch to lower organization groups and automatically update device results by using the organization group drop-down menu.
Toggle between views by selecting the List View icon ( ) and Chart View icon (
 ). Select any metric to open the Device List View for that specific set of devices. You can then perform actions such as sending a message to those devices.
Customize the Monitor by selecting the Available Sections icon ( ). Select or deselect check boxes representing available sections (Devices, Compliance, Profiles, and so on) and select Save to craft the Monitor Overview.
App and Profile Monitor
Track the deployment of an application or profile to end-user devices with the App and Profile Monitor. This monitor provides at-a-glance information on the status of your deployments.
- Navigate to Monitor > App and Profile Monitor.
- In the search field, enter the name of the app or profile. You must select the Enter key on your keyboard to start the search.
- Select the app or profile from the drop-down menu and select the Add button.
The app or profile data displays on a card. You can only have five cards added at one time.
The App and Profile Monitor displays the current deployment status for devices during a deployment. The status combines different app and profile installation statuses into Done, Pending, or Incomplete.
Intelligence
Note: You must have a Cloud Services account to access Workspace ONE Intelligence.
Custom reporting and advanced analytics from Workspace ONE Intelligence can provide you with deeper insights about your device fleet. Such insights include enhanced visibility on performance issues, highly effective planning tools, and faster deployment times.
Ensure that you are in a customer type organization group, then navigate to Monitor > Workspace ONE Intelligence, select the Get Started button to see how Intelligence works, and then the Opt In button to take advantage of the service.
You can opt out of Intelligence custom reporting at any time.
For more information, see the Workspace ONE Intelligence Products guide.
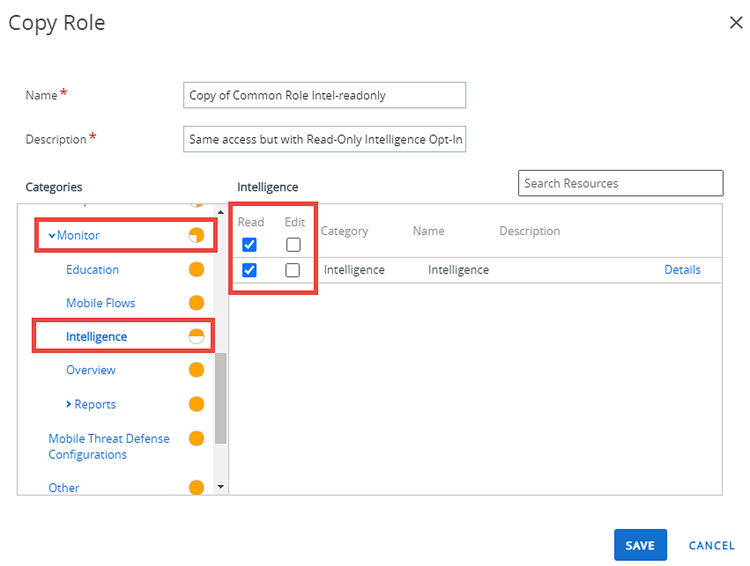
IMPORTANT: Limiting the number of administrators that can change the Workspace ONE Intelligence opt-in setting prevents data collection oversights and sync errors. If you want to prevent admins from changing the opt-in setting, then you must edit the role that is used by those admins to allow "Read-Only" access to Intelligence. Note that any changes you make to an admin role applies to all admins who are assigned that role. If you want the access changes to affect only a subset of admins, then you must make a copy the original admin role, update the Intelligence permission to "Read-Only", and assign this role copy to your targeted admins.
- These admins will enjoy all the same access as before, just with read-only access to the Intelligence Opt-in setting.
Take the following steps to change the role used by these admins.
-
Navigate to Accounts > Administrators > Admin Roles.
-
Locate the name of the role you want to change.
- If you are making a copy of this role, then enable the check box to the left of the role name and select the Copy button that displays above the listing. The Copy Role screen displays.
- If you are not making a copy, then select the edit icon (
 ). The Edit Role screen displays.
-
In the Categories panel, scroll down and select Monitor, then select Intelligence, then select the Read checkboxes and deselect the Edit checkboxes.
-
Select Save.
The new role assignments are not applied until the next time these admins log in.
Licensing Information
The Workspace ONE Licenses screen provides an overview of module license information and deployed Workspace ONE UEM components condensed into two separate sections, Active Products and Deployed Components. Access the Admin Panel by navigating to Monitor > Workspace ONE Licenses. The Workspace ONE Licenses can only be accessed from a Customer type organization group.
Note: The content displayed in these sections is largely dependant upon your specific environment.
The Active Products section identifies active products and displays summarized license information, including license model and license type.
The Deployed Components section features a panel for every enabled component at the customer organization group, each reporting the connectivity status.
Reporting
Workspace ONE UEM lets you access detailed information about the devices, users, and applications in report form that you can analyze with Excel. For more information, see Reports and Analytics.
[Insertion point for the Reports & Analytics Guide, condensed version]
Events and Logs
Events are records of administrative and device actions that the Workspace ONE UEM console stores in logs. Export event logs as CSV files. You can also configure the Workspace ONE UEM console to send the event logs to your Security Information and Event Management tools or Business Intelligence systems.
The event logs show both device events and Workspace ONE UEM console events. Device events show the commands sent from the console to devices, device responses, and device user actions. Console events show actions taken from the Workspace ONE UEM console including login sessions, failed login attempts, admin actions, system settings changes, and user preferences.
You can filter the date range, severity level, category, or module.
Severity levels include the following descriptions.
- Critical – Indicates a failure in a primary Workspace ONE UEM console system.
- Error – Indicates a failure in a non-primary Workspace ONE UEM console system.
- Warning – Indicates an issue in the future if action is not taken.
- Notice – Indicates unusual conditions.
- Information – Indicates normal operational data.
- Debug – Indicates useful information for troubleshooting.
Note: If the Date & Time option returns more than 10,000 events, then a banner message displays recommending that you select a smaller date range. If you prefer a larger date range, then run an event report for each multiple child OG rather than a single event report on a single parent OG.
For larger environments that have more than 3 days' worth of events, even after filtering and limiting reports to individual child OGs, you might consider centralizing this data to a Security Information and Event Management (SIEM) tool, and generating reports to monitor activity, perform log audits, and respond to incidents. Workspace ONE UEM integrates with your SIEM tools by sending event logs using Syslog. For more information, see Syslog Integration.
Device Events
Device events are a listing of several different kinds of events logged by the system. It lists Mobile Device Management (MDM) commands to devices, device responses, and device user actions. You can filter the log by date range, the severity level, category, or module.
Severity levels for device events include the following descriptions.
- Emergency – Indicates a catastrophic MDM failure requiring immediate attention.
- Alert – Indicates a failure of a foundational MDM system requiring attention.
- Critical – Indicates a failure in a primary MDM system.
- Error – Indicates a failure in a non-primary MDM system.
- Warning – Indicates an issue in the future if action is not taken.
- Notice – Indicates unusual conditions.
- Information – Indicates normal operational data.
- Debug – Indicates useful information for troubleshooting.
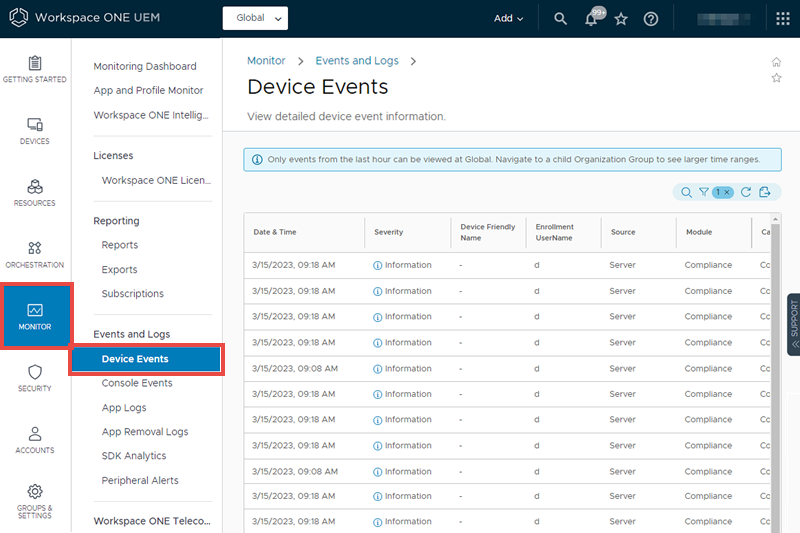
Examine device event logs by taking the following steps.
-
Navigate to Monitor > Events and Logs > Device Events.
-
Apply a filter (
 ) to the list of device events. The behavior of this filter differs from other listing filters in Workspace ONE UEM. When you clear all filters from the Device Events listing, the listing displays only today's device events.
Choose from:
- Date & Time (see Note above)
- Severity
- Category
- Module
-
View details of a specific device event by selecting the Event option.
-
View details of a specific device by selecting the Device Friendly Name option.
-
You can Add Device, Edit options, and Change Organization Group by selecting the Enrollment UserName option.
Console Events
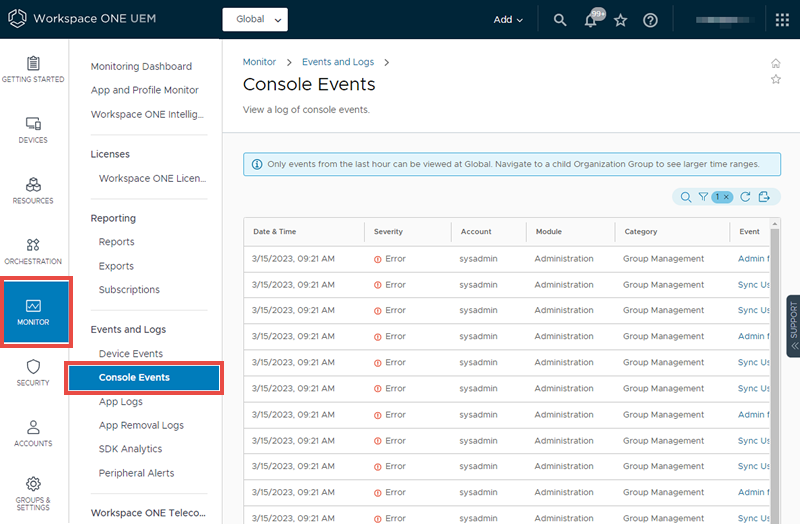
Console events show MDM actions from the Workspace ONE UEM console that include the following examples: Login sessions, Failed login attempts, Admin actions, System settings changes, and User preferences.
-
Navigate to Monitor > Events and Logs > Console Events.
-
Apply a filter (
) to the list of console events. The behavior of this filter differs from other listing filters in Workspace ONE UEM. When you clear all filters from the Console Events listing, the listing displays only today's console events.Choose from:
- Date & Time (see Note above)
- Severity
- Category
- Module
-
View details of a specific console event by selecting the Event option.
App Logs and App Removal Logs
The app logs lets you view and download availablelog files having to do with apps managed by Workspace ONE UEM. The App Removal Log contains apps with any non-active command status, including held for approval, dismissed by admin, paused, unpaused, and reset.
SDK Analytics
You can view information for apps created with the Workspace ONE SDK or apps using SDK functionality.
Peripheral Alerts
This log collects all alerts that originate from connected printers and other peripherals.
Change Syslog Settings
You can make Syslog setting changes. Navigate to the settings page at Groups & Settings > All Settings > System > Enterprise Integration > Syslog.
For more information, see Syslog Integration.
Change Event Settings
You can change the minimum logging level for events. Navigate to Groups & settings > All Settings > Admin > Events and select the Event Settings button.
Set the minimum log level for Device and Console events. Events that meet the selected levels and above for both Device and Console are captured and stored by the Workspace ONE UEM database and displayed in the Workspace ONE UEM console on the Monitor > Events and Logs > Device Events and Console Events pages.
Telecom Information
Foundational Telecom is a way to track basic telecom usage information from enrolled devices in your environment in order to help reduce overage and roaming costs for the enterprise.
Navigate to Monitor > Workspace ONE Telecom > Telecom Dashboard and select the Configure button to enable these settings and begin viewing these analytics.
To access Telecom Management, which includes more robust functionality to configure granular plans and enables automated compliance rules, please speak with your sales representative.
Was this page helpful?