Using debugging logs, you can troubleshoot issues related to network, rendering, and get additional information on the errors for Workspace ONE Web.
Enable Debug Logs on Web
To enable debug on Web, configure the following settings.
1. Configuration on UEM Console
- Enable Debug.
| Settings | Navigation |
|---|---|
| Default SDK settings | Settings > Apps > Settings and Policies > Settings > Logging (ENABLED) > Logging Level. Select Debug from the drop-down. |
| Custom SDK profile | Resources > Profiles & Baselines > SDK profiles > Open > Logging > Configure > select Enable Logging check box > Logging Level. Select Debug from the drop-down. |
-
Ensure to remove any previous logs on UEM Console.
- Navigate to Devices > List View.
- Open the impacted device details.
- Navigate to More > Attachments > Documents tab and click X to delete any existing AppLogs if available.
2. Configuration on the Device
- On the device, ensure to clear all the Web app data.
- Launch Web and navigate to More > Settings > Support > Enable Diagnostic Logging.
- Ensure that you do not close the Web app.
- Return to the Web app Home screen.
3. Collect the Diagnostics Logs
- Enable Debug Logs on Web.
- Reproduce the issue.
- On Web, go to More > Settings > Support.
- Tap Send logs to Administrator.
- On UEM Console, navigate to the respective Device details page > More > Attachments > Documents.
- Tap Get all log files (.zip file).
Chrome Debugger and other DevTools logs on Android
-
Discover the Android device.
-
Open the Developer Options screen on your Android device.
-
Select the Enable USB Debugging check box.
-
On your development machine, open Chrome.
-
Go to
chrome://inspect#devices. -
Ensure that the Discover USB devices check box is selected.
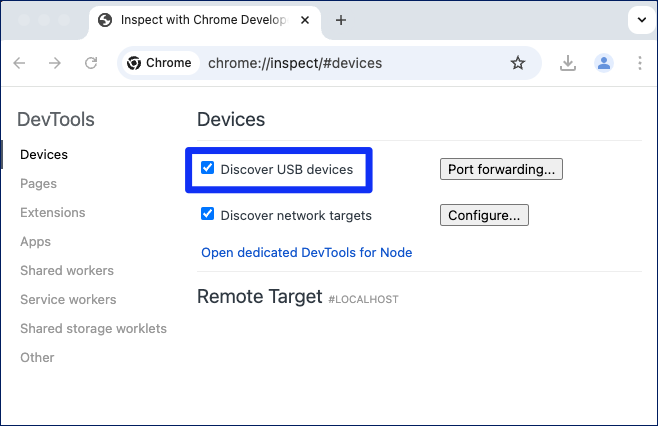
-
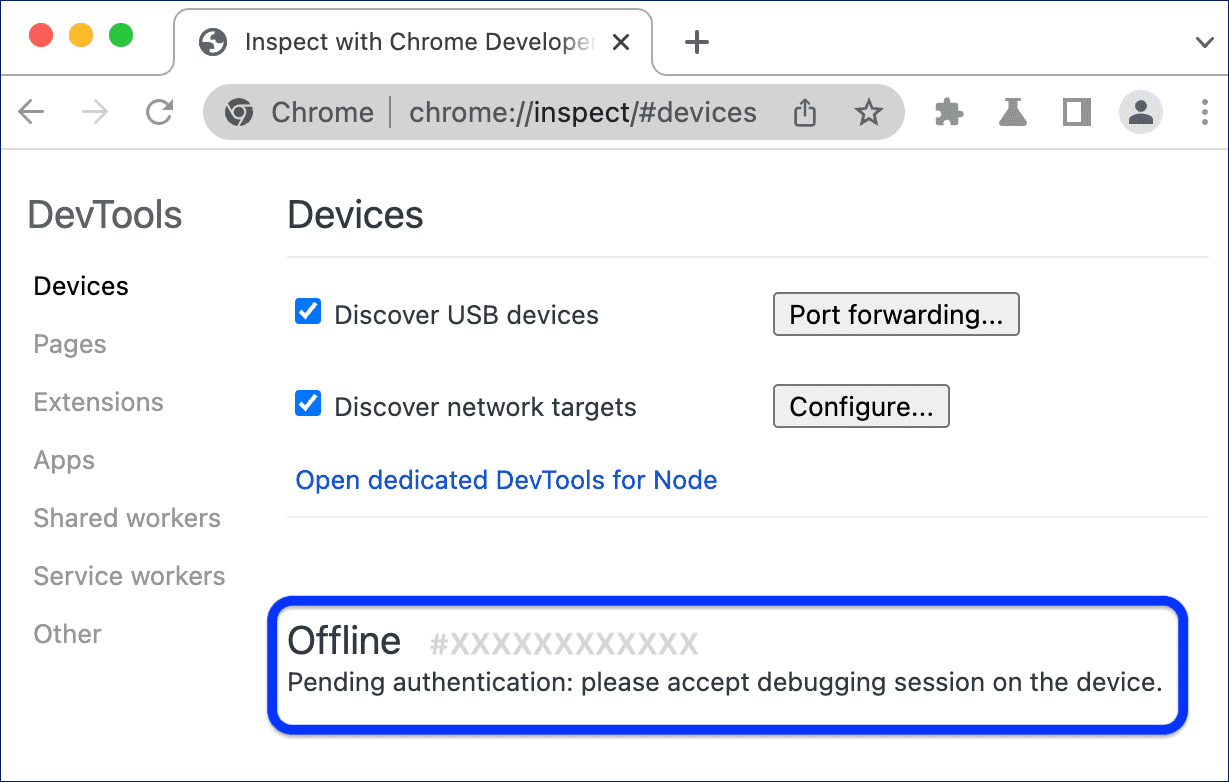
Connect your Android device directly to your development machine using a USB cable. In this case, accept the debugging session prompt on your device's screen.
- If you are connecting your device for the first time, the device will show as "Offline" and "Pending authentication".
- If you see the model name of your Android device, DevTools has successfully established the connection to your device.
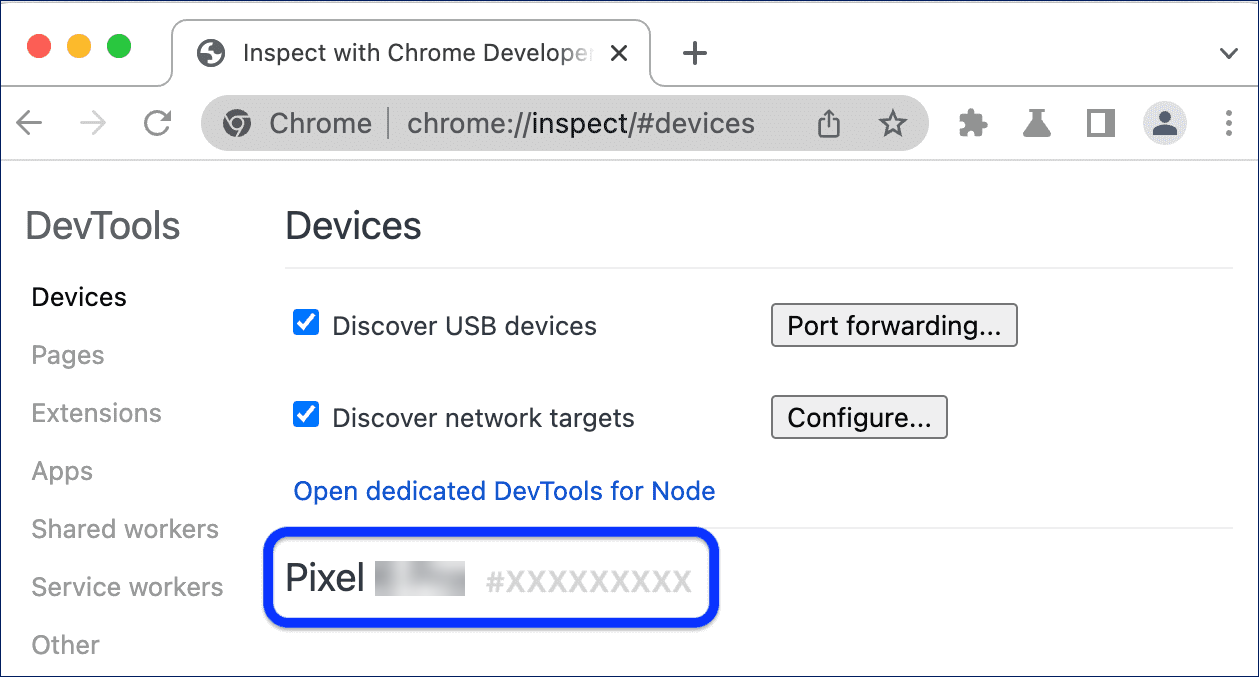
- If you do not see the device name as mentioned, check if Enable USB Debugging check box is selected on Developer Options screen. Additionally, plug-in the device to another USB port on your development machine and check the quality of the connecting cable.
- If you are connecting your device for the first time, the device will show as "Offline" and "Pending authentication".
-
Navigate to the webpage which needs to be inspected and click inspect to open the DevTools window.
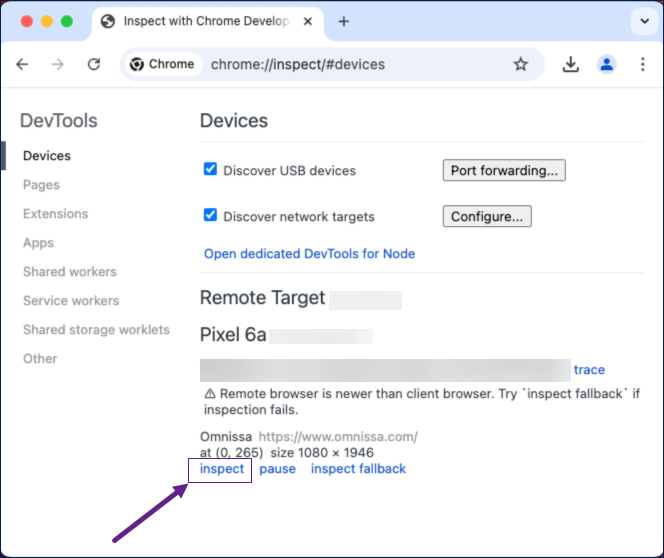
-
Collect the logs for any URLs that you want to troubleshoot.
Safari Web Inspection other DevTools logs on iOS
- Discover your iOS device
- Enable Debug Logs on Web.
- Go to Privacy & Security settings on your iOS device and turn on the Developer Mode toggle.
- Restart the iOS device.
- Launch the Web app and ensure that the Web Diagnostic Logging toggle is turned on.
- Connect your iOS device directly to your development machine using a required cable.
- On your development machine, open Safari (Desktop Browser).
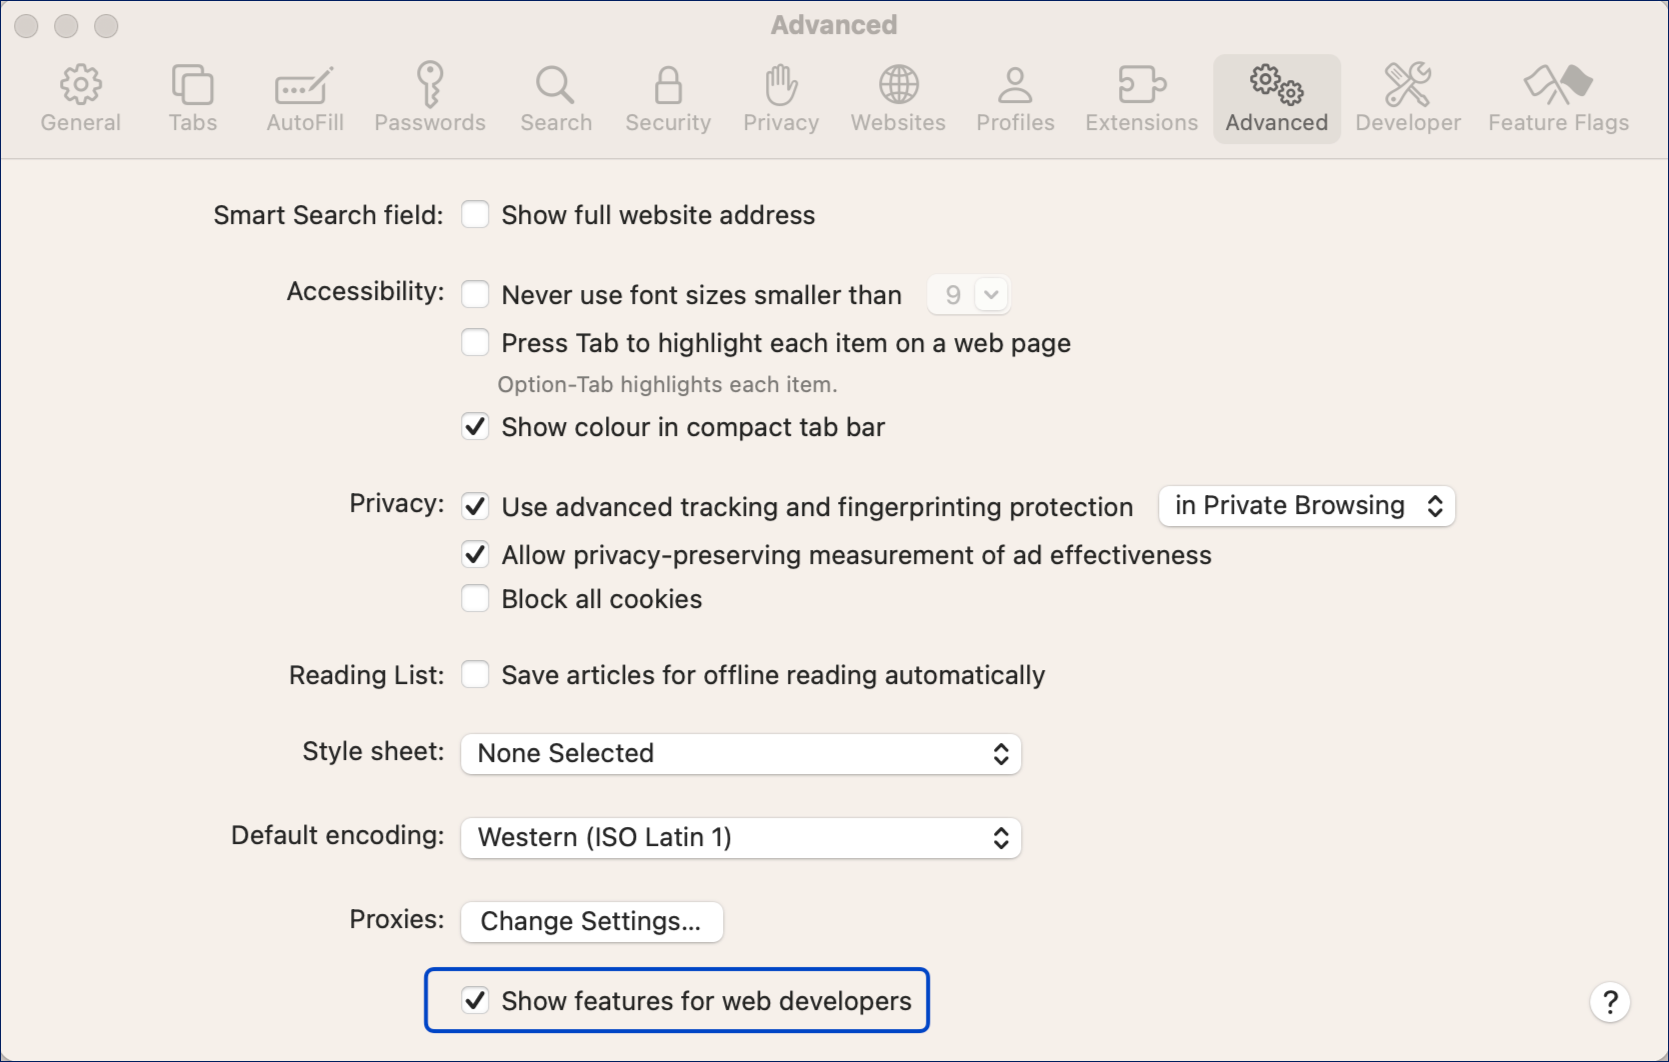
- Go to Settings > Advanced tab and select the Show features for Web developers check box.
The connected device will be available on the Develop menu on Safari Desktop browser.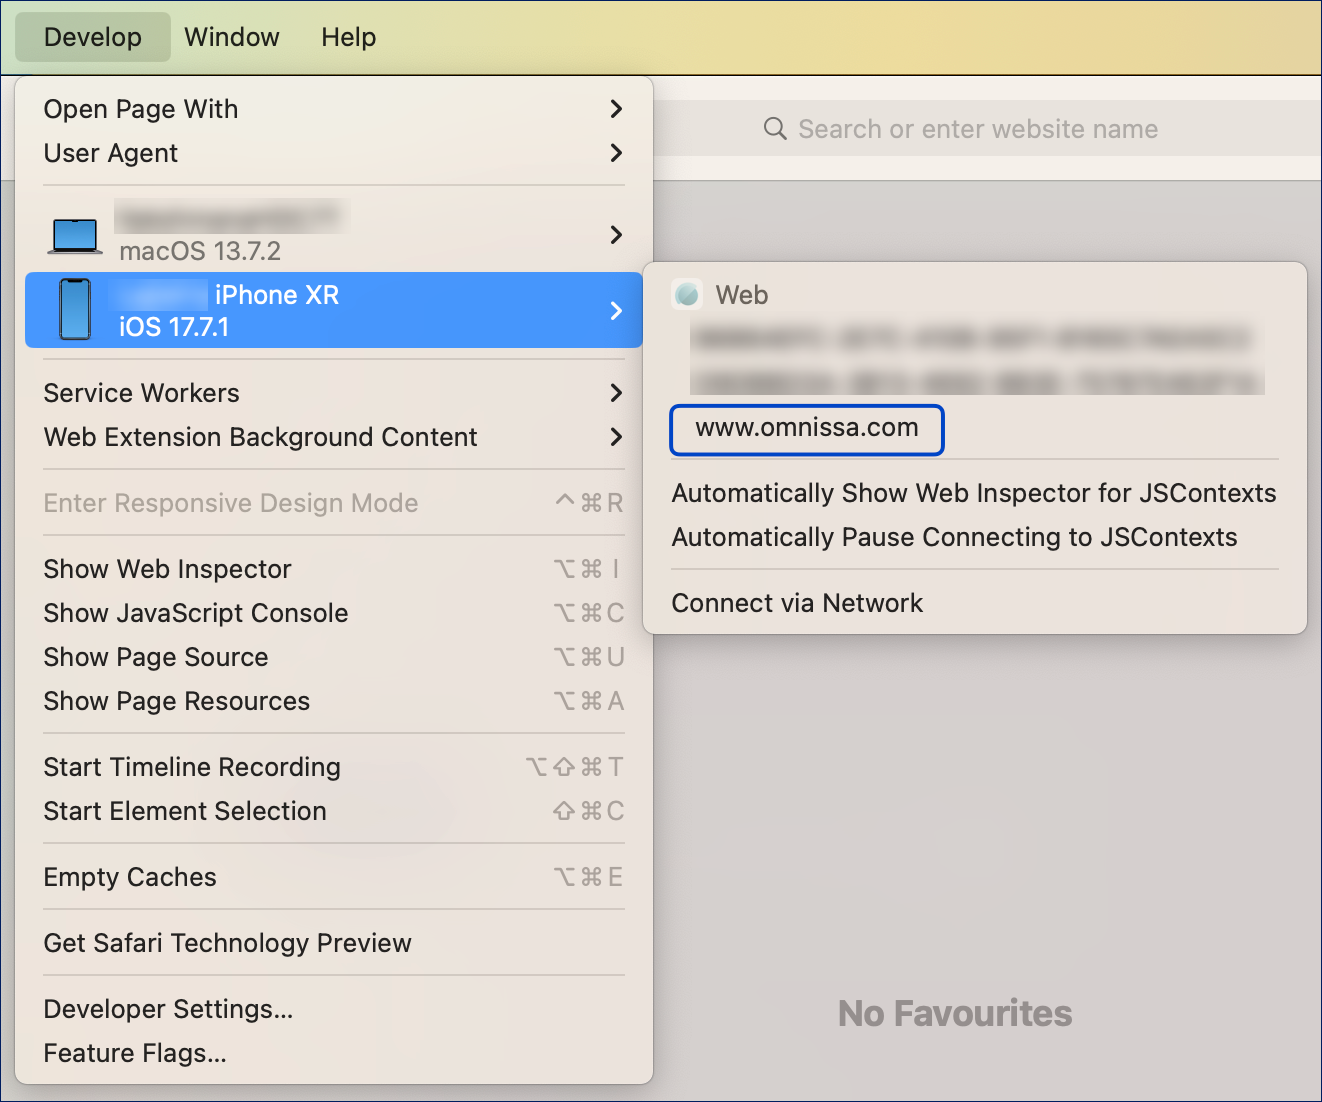
- Click on the URL to open the Safari Developer tool (Web Inspector tool) and debug the corresponding webpage.
Note: If you are connecting your device for the first time, the development machine will prompt for permission to allow/access the connected iOS device.
If you do not see the device name as illustrated, ensure that the Developer Mode is enabled. Alternately, plug-in the device to another port on your development machine and check the quality of connecting cable as well. - Collect the logs for any URLs that you want to troubleshoot.
Was this page helpful?