This article explains how you can view the health status of services running on a primary or worker node in a Horizon Cloud Connector cluster. You view this information using the Horizon Cloud Connector configuration portal.
Procedure
-
Get the URL for launching the Horizon Cloud Connector web-based configuration portal.
You can find this URL displayed on the node's blue console screen after you power on the node using vSphere Client. The URL follows the format
https://<IP address>, whereis the IP address of the primary or worker node. -
Using a browser, go to the URL that you got earlier for the primary or worker node.
The configuration portal opens to the screen that displays the status of Horizon Cloud Connector components and services.
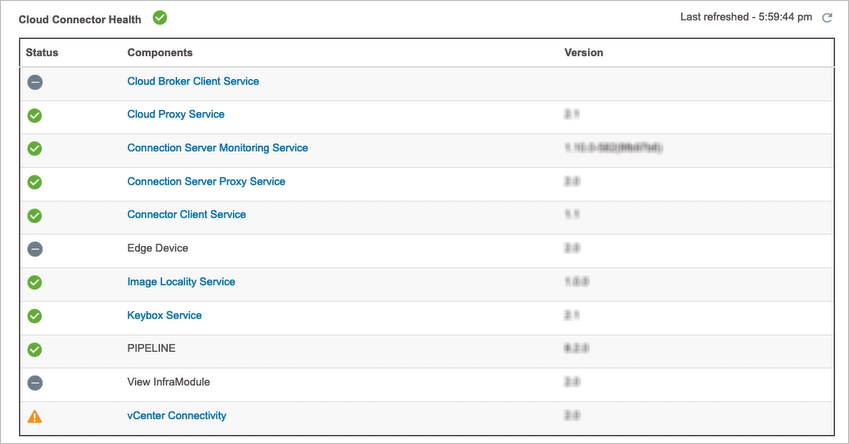
The configuration portal displays the health status of services running in both the primary and worker nodes of the cluster. If a service appears as a linked entry, you can click it to display details about the Kubernetes pods running for that service and the node on which each Kubernetes pod resides.
The following screenshot shows an example of a health status list in the configuration portal.
-
To view detailed information for a service, click that linked entry.
A dialog box appears with details such as the name and health status of the individual Kubernetes pods running for that service, the node on which each Kubernetes pod resides, and the number of times the service has restarted.
Was this page helpful?