The Cost Insights page in Horizon Universal Console helps administrators track Microsoft Azure costs, monitor utilization, and optimize resource spending for Microsoft Azure Edge deployments. The page provides detailed cost analysis to help you identify where costs occur and where savings opportunities might exist. You can view this cost, savings, and utilization data at either the pool group level or the individual pool level.
Important:
-
Cost Insights are available only for Microsoft Azure Edge deployments. This feature is not available for other provider deployments.
-
Recommendations are generated for only Floating and Multi-Session pools. Recommendations for Dedicated pools are not yet available.
-
Cost Insights data might be delayed by up to three days due to data collection and processing from Microsoft Azure costs and savings data.
-
If you use a custom role to make API calls to your Microsoft Azure subscription, include the appropriate Azure Cost Management related permissions as described in To Use a Custom Role for Horizon Cloud App Registration.
Viewing Cost Information
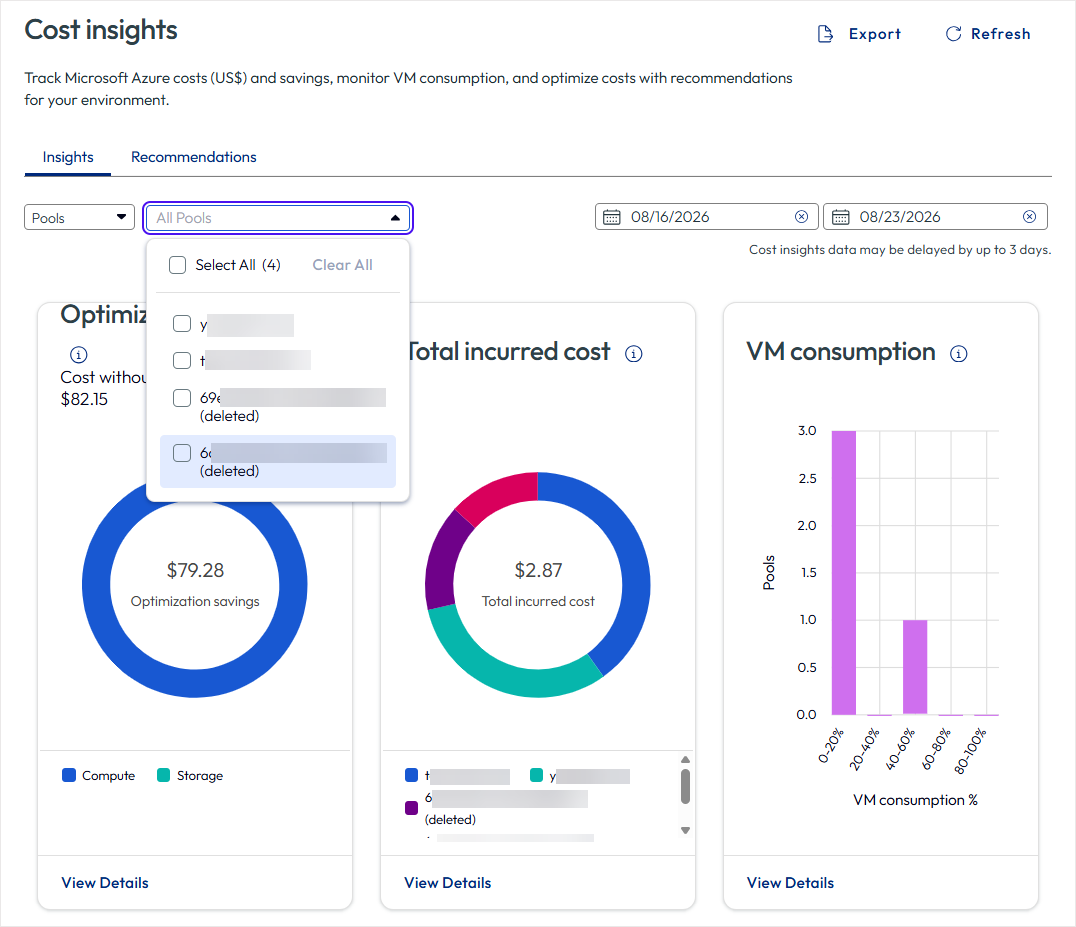
The Cost Insights page displays the following key metrics. Use the Pools / Pool Groups selector at the top of the page to choose whether these metrics are shown per pool or per pool group. All three metrics below update to reflect your selection.
Optimization Savings Chart: Shows the cost savings achieved through Horizon Cloud power management policies that you have already configured and enabled. This metric displays:
-
Cost without Horizon policies: The estimated cost if your VMs ran continuously for 24 hours without any power management policies applied.
-
Optimization savings: The actual dollar amount saved by using Horizon power management features.
-
A circular chart showing the breakdown of savings by category:
- Compute: Savings from power management and spare management actions, including autonomous mode, power-off, hibernate, de-provisioning VMs, and scheduling (auto scaling).
- Storage: Savings from reduced storage consumption when VMs are powered off or deprovisioned, and when the Autodisk Switching feature is enabled (auto scaling and auto scale disk type).
- The dollar value of optimization savings achieved relative to the cost without policies.
The system calculates optimization savings by comparing the actual incurred costs against a ceiling cost (what you would pay if VMs ran 24/7). The difference represents the savings achieved through power management features such as VM timeout policies, auto-scaling, and automatic disk switching. For more information about configuring these power management options, see Managing Power Options for Pools and Pool Groups.
The following table describes how each savings category is attributed:
| Savings Feature | Calculation Method |
|---|---|
| Spare Policies | Avoided runtime cost of VMs that were not launched due to spare management. |
| Power Policies | Reduced runtime from logoff or hibernation compared to a continuous-run baseline. |
| Autodisk Switching | Difference in cost between the originally chosen disk SKU and the optimized disk SKU. |
Total Incurred Cost Chart: Displays the total Azure costs for your Horizon Cloud environment during the selected date range. This includes:
-
All pool or pool group costs associated with your deployment, depending on the selected view.
-
A circular chart providing a visual representation of costs by pool or pool group.
VM Consumption Chart: Presents a bar chart showing the percentage of VMs being actively used within your pools or pool groups over time. This visualization helps you:
-
Identify usage patterns and trends across your deployment.
-
Understand peak consumption periods when most VMs are in use.
-
Determine if your pool groups are appropriately sized (100% consumption indicates all available VMs are being utilized, which is optimal).
-
Plan capacity based on historical demand patterns.
Filtering and Date Range Selection
At the top of the Insights tab, you can filter the displayed data.
-
Pool / Pool Groups: Choose whether to view cost data by pool or by pool group. Select Pool Groups to filter by one or more specific pool groups (or keep the default All Pool Groups to see aggregate data across your organization), or select Pools to filter by one or more individual pools. When you change this selection, all three charts on the Cost insights page (Optimization savings, Total incurred cost, and VM consumption) update to show data for the selected pools or pool groups.
Note: If a pool group has been deleted, its ID name remains visible in the Pool Groups dropdown so that you can continue to view historical cost data for that group.
-
Date Range: Choose the time period for cost analysis. By default, the page displays data for the last 7 days. A maximum date range of 31 days is supported. The date picker allows you to select custom start and end dates to focus on specific periods of interest.
Note: When you navigate to detailed views by clicking View Details links, the selected pool or pool group and date range filters are automatically carried forward to the detail pages. These filters remain applied as you navigate between Cost Insights pages until you either change them or navigate away from the Cost Insights section entirely.
Important: Cost insights data may be delayed by up to three days, as indicated in the information banner at the top of the page.
Exporting Data
A Export button is available in the upper right corner of the Cost Insights page. This will let you export the underlying raw cost data to Excel, so admins can move Azure cost data for deeper analysis and reporting.
- You can export data for a selected period of up to 90 days. This export range is independent of the 31-day maximum used for the on-screen Cost Insights charts.
- Exported files are generated and made available through the Download Manager in the console under Monitor > Downloads.
Refreshing Data
A Refresh button is available in the upper right corner of the Cost Insights page. Click this button to retrieve the latest cost insights data from Microsoft Azure. This is useful in rare scenarios where API failures have prevented data from loading correctly, or when you want to ensure you're viewing the most current available information.
Using View Details Links
The Cost Insights page includes three View Details links that provide access to more detailed information:
-
Optimization Savings Chart - View Details Opens the Optimization savings page where you can:
- View the optimization savings data in both chart and table format.
- See savings broken down by pool or pool group.
- Change the pool group selection and date range (filters are inherited from the main Insights page).
- View detailed savings information, including compute and storage cost reductions.
-
Total Incurred Cost Chart - View Details
-
VM Consumption Chart - View Details
Both View Details links for Total Incurred Cost Chart - View Details and VM Consumption Chart - View Details (two and three above) open the same Cost Details page, which defaults to the By Resources tab and shows the relationship between VM consumption and associated costs.
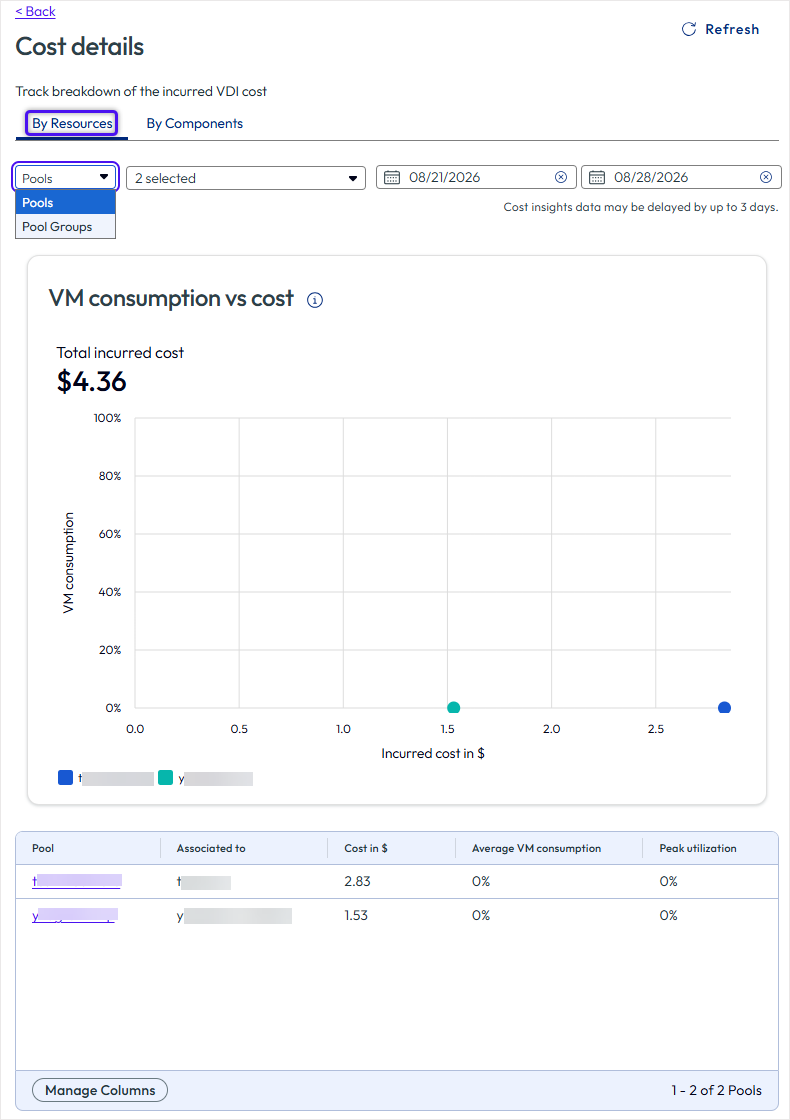
On this page you can:
-
Change the pools/pool group selection and date range (filters are inherited from the main Insights page).
-
View the "VM consumption vs cost" chart that displays how consumption patterns relate to incurred costs.
-
See both chart and table views of consumption and cost data for each pool or pool group.
-
See a new grid showing cost, consumption, and utilization at the individual pool level (pool, parent pool group, cost, consumption, utilization), in addition to the existing pool-group-level grid.
-
Analyze which pool or pool groups are incurring the highest costs relative to their utilization.
Note: To see cost trends, savings, and recommendations for an individual pool you can also go to that pool's details page and select the Insights and Recommendations tab (see Insights and Recommendations Tab (Pool and Pool Group Details) below).
The Cost details page also displays a cost breakdown for different VM sizes within the selected pools or pool groups. This view shows:
-
Cost aggregated by VM model at the pool/pool group level.
-
Cost components for each VM size, including compute, storage, egress, licensing (if applicable), and other costs.
-
The pools associated with each VM size, so that administrators can identify which pools are using a given VM size and resize them if necessary.
Note: The Cost details page provides insights into the relationship between your VM usage and the resulting Microsoft Azure costs. For information about configuring power management options to optimize costs, refer to Managing Power Options for Pools and Pool Groups.
Also on the Cost Details page, if you click the By Components tab you can view costs broken down by compute and storage on a day-by-day basis.
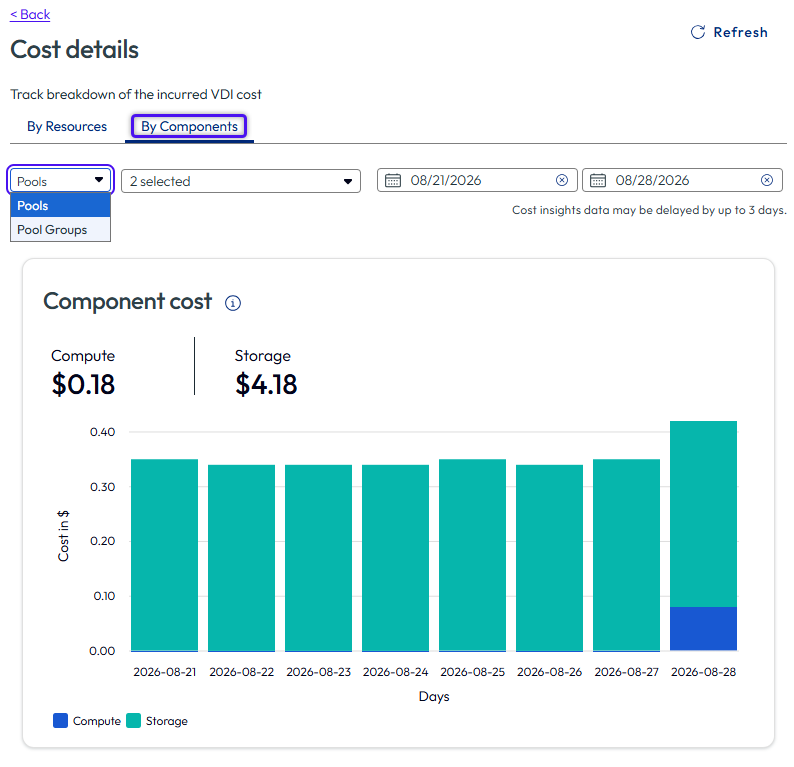
Viewing Cost Data by Pool, Pools, and/or Pool Groups
On the Cost Insights page, you can view cost, savings, and utilization data at various levels of granularity. The drop-down selection box allows you to filter by a single pool, multiple pools, a single pool group, or multiple pool groups. This targeted view helps you identify specific pools that are driving costs or should be resized, and makes it easy to compare costs across pools and pool groups.
-
Use the Pools / Pool Groups selector at the top of the Cost Insights menu page to choose which level of detail to view.
-
Selecting Pool Groups shows the existing aggregate view across one or more pool groups.
-
Selecting Pools shows the same three metrics (Optimization savings, Total incurred cost, VM consumption) broken out by individual pool.
-
Your selection carries forward automatically when you navigate to View Details / Cost details pages, so you don't need to reselect it there.
-
On the Cost details page, a pool-level grid (pool, parent pool group, cost, consumption, utilization) is available alongside the existing pool group level grid.
Insights and Recommendations Tab (From the Pools and/or Pool Groups Menu)
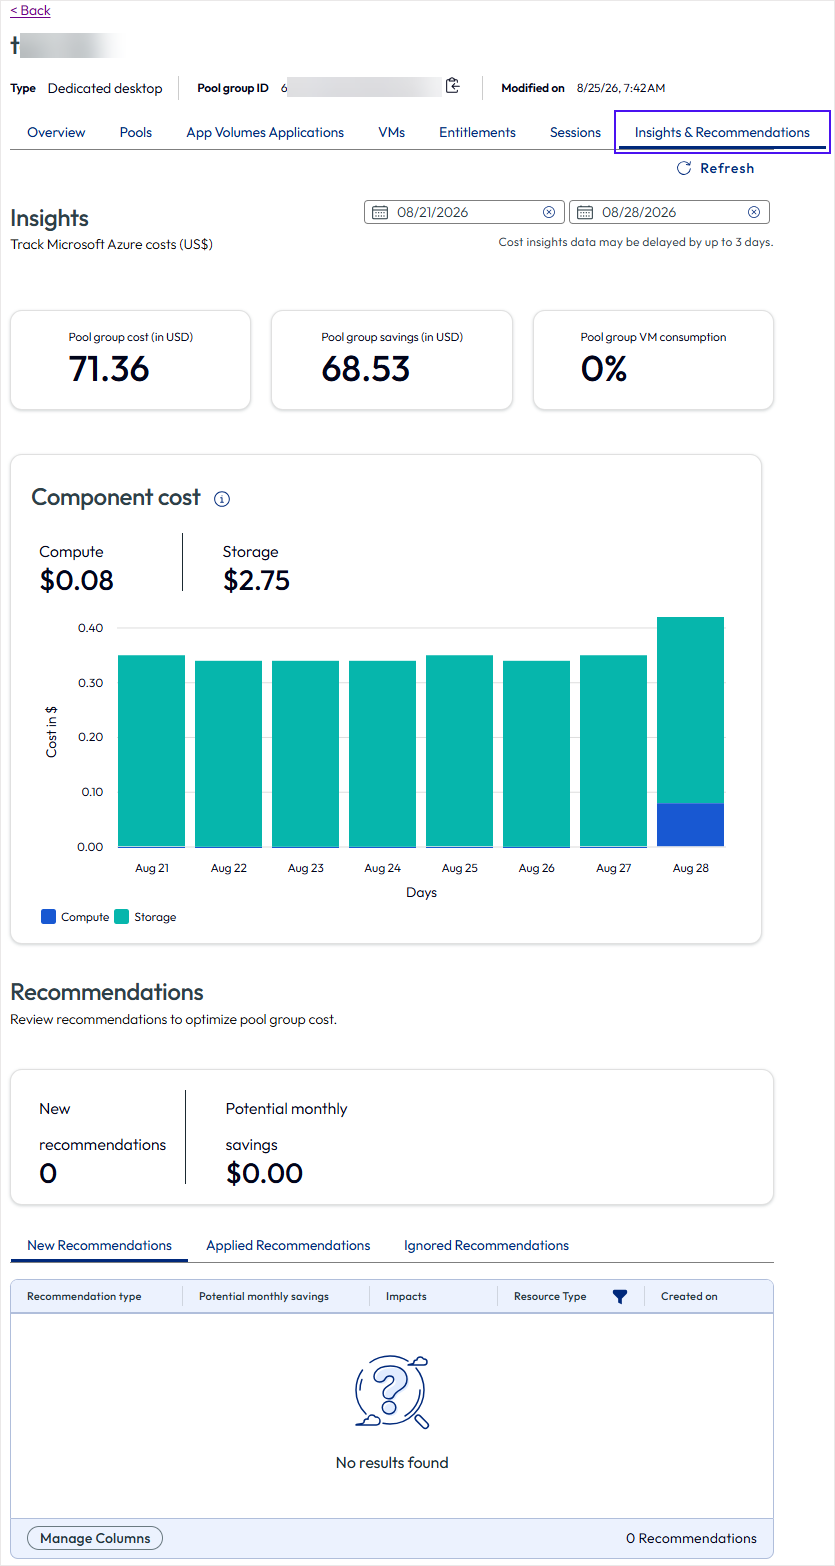
To make cost information easier to find while managing a specific pool or pool group, Horizon Cloud adds an Insights and Recommendations tab directly on that pool's or pool group's details page, you no longer need to leave the Pools or Pool Groups menu page and go to the separate Cost insights menu to see its cost picture.
-
Location: Pools details page or Pool Groups details page, alongside the existing tabs. (Navigate to: Pools > Select the Pool > Insights & Recommendations tab, or Pool Groups > Select the Pool Group > Insights & Recommendations tab)
-
What it shows:
- For a pool group: the same cost, savings, consumption-trend, and recommendation data that you would otherwise find in Cost Insights, scoped to just that pool group.
- For an individual pool: inline cost trends, projected optimization savings, and specific pool-level recommendations, scoped to just that pool.
-
When to use it: when you're already working within a pool or pool group and want immediate visibility into its cost, savings, and efficiency without switching context or navigating away from the pool or pool group management view.
Viewing Recommendations
The Recommendations view of the Cost insights page provides actionable suggestions to reduce Microsoft Azure costs while maintaining service quality. Recommendations are generated by analyzing your pool and pool group usage history, and the system re-evaluates your environment on a recurring basis to surface new optimization opportunities as usage patterns change.
Note: Recommendations require a period of usage history before they can be generated. You won't see recommendations immediately after creating a pool or pool group.
At the top of the Recommendations view:
- New recommendations: The number of recommendations you haven't reviewed yet.
- Potential monthly savings: Total estimated savings if you implement all recommendations currently shown under New Recommendations.
Recommendations are grouped into three views:
- New Recommendations: Suggestions that require your review and action.
- Applied Recommendations: Recommendations you've already implemented.
- Ignored Recommendations: Recommendations you've chosen not to implement.
Each recommendation includes:
- Recommendation type: The category of optimization being suggested.
- Potential monthly savings: Estimated cost reduction if you implement the recommendation.
- Impacts: The pool or pool group that will be affected.
- Resource Type: Pool or Pool Group.
- Created: Date and time the recommendation was generated.
Recommendation Types Available Today
The recommendations view generates three types of cost-optimization suggestions for Floating and Multi-Session pools:
-
Auto Disk Switching (also referred to as Enable Auto Scale Disk Type): Recommends enabling automatic disk type switching so the OS disk downgrades to a lower-cost tier when VMs are powered off, and restores the original tier when they're powered back on. This can significantly reduce storage costs during non-use periods.
-
Pool Sizing Optimization (also referred to as Decrease Max Provisioned VMs): Recommends lowering the maximum number of VMs provisioned for a pool when actual usage is consistently well below that ceiling, so you're not paying to keep unused capacity provisioned.
-
Power Policy Optimization (also referred to as Decrease Min Powered On VMs): Recommends lowering the minimum number of VMs kept powered on in a pool group's power management policy when actual demand doesn't require that many VMs on standby.
Support for Dedicated pools, and additional recommendation types (including reevaluating provisioning approach, power management schedules, and occupancy-based power management mode), are planned for a later release and are not covered in this topic.
Taking Action on a Recommendation
For each recommendation, you can do the following:
Apply a recommendation:
-
Review the recommendation: Expand a recommendation row to view complete details, including:
- The specific pool or pool group affected.
- Current configuration values.
- Recommended configuration values.
- Estimated monthly savings.
-
Navigate to configuration: Click Edit Policy. The system automatically:
- Opens the appropriate configuration page (pool settings or pool group settings).
- Navigates directly to the specific step containing the setting that needs to be changed.
- Displays an information banner at the relevant field showing both the current and recommended values.
-
Make the change: Update the configuration field from the current value to the recommended value shown in the banner.
-
Save and verify: After you save your changes, the recommendation automatically moves from New Recommendations to Applied Recommendations, so you can track which optimizations you've implemented.
Manage a recommendation:
- Ignore a recommendation: If a recommendation doesn't align with your requirements, click Ignore. It moves to Ignored Recommendations and is removed from your active review list.
- Re-evaluate an ignored recommendation: Open Ignored Recommendations to review previously dismissed suggestions. If your requirements change, click Undo to move the recommendation back to New Recommendations.
Filtering Recommendations
Use the All Pool Groups dropdown at the top of the Recommendations view to filter recommendations by specific pool groups, so you can focus on optimization opportunities for particular areas of your deployment.
Refreshing Recommendations Data
Click the Refresh button in the upper right corner of the Recommendations view to retrieve the latest recommendations based on current usage patterns and cost data.
Best Practices for Cost Management
To maximize cost savings while maintaining user experience:
- Review the Cost Insights page regularly (at least weekly) to stay informed about spending trends.
- Implement new recommendations promptly, especially those with high potential savings.
- Use the date range filter in the Insights view to identify cost spikes and investigate their causes.
- Configure appropriate power management policies to reduce costs during off-peak hours.
- Monitor the Optimization savings metric to track the effectiveness of your cost management strategies.
- Set up auto-scaling schedules that align with your organization's business hours and usage patterns.
Was this page helpful?