When your Horizon Cloud deployment is integrated with Workspace ONE Intelligence, you can use the Horizon Universal Console Home page to monitor resources.
Note: There may be a time delay in the display of current, real-time data and insight information. The monitoring data is coming from the Horizon Agent and is sent to the Workspace ONE Cloud data lake. Horizon Universal Console queries the data lake to populate the dashboards. In a worst-case scenario, this end-to-end processing can result in delays of up to 30 minutes.
In terms of monitoring, the goal of the Home page is to display information that helps administrators quickly determine the following types of information:
- The overall health of their Horizon Cloud deployment:
- Horizon Edge infrastructure errors.
- Pool provisioning errors.
- Horizon Agent errors, for agents running within multi-session and single-session VMs.
- Issues that are clearly identifiable.
- Issues that indicate more investigation is necessary.
- Issues that indicate administrators can take a monitoring approach in the short term.
- Issues that require immediate corrective action.
- The real number of connected sessions and disconnected sessions.
- The real number of VMs experiencing performance issues, such as high CPU, memory, and disk issues.
- Capacity usage data, including usage of the top 3 pool groups, pools, and Unified Access Gateways.
From the Home page, you can view or easily navigate to data that indicates end users are currently experiencing issues accessing desktops or applications, or that end users might soon experience issues unless you take action.
You can start viewing and interacting with the resource-monitoring data on the Home page after you deploy Horizon Edge and after Horizon Cloud integrates with Workspace ONE Intelligence. More resource-monitoring data becomes available as you continue deploying Horizon Cloud.
The Home page consists of two sections. The top section consists of buttons that are links to Horizon Cloud resources. The resource buttons are direct links to your Horizon Cloud resources. The bottom section consists of data about your resources, with which you can view and interact.
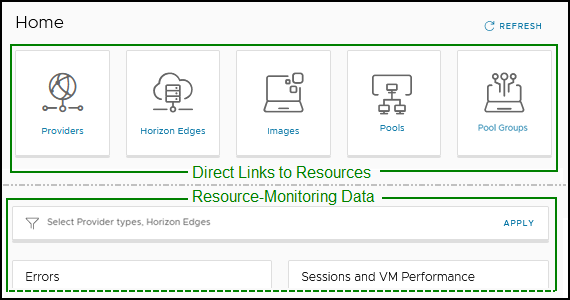
The information that follows explains how you can interact with the resource-monitoring data that is available on the Home page.
Select the Horizon Edges to Monitor
The Home page displays resource-monitoring when you use the Select Provider types, Horizon Edges filter. You can filter by provider types and Horizon Edges that belong to the selected provider types and click Apply to display Errors data and live information about Sessions and VM Performance for the end user for the different provider types, such as Microsoft Azure and Horizon 8.
By default, the Home page displays resource-monitoring data, with the exception of the Pools data, for all of your Horizon Edges.
Note: The Pools box in the Utilization section applies to all pools across all of your Horizon Edges, regardless of which Horizon Edges you select with the Select Horizon Edges filter.
The Horizon Agent Monitoring data is conveyed to Workspace ONE Intelligence and is integrated with Horizon Cloud, or Splunk depending on the licensing. The Workspace ONE Intelligence data integration with Horizon Cloud is activated after you enable the Horizon Agent Monitoring. For more information, see Configuring Horizon Edge Agent Data Monitoring for Horizon Edge with Workspace ONE.Data integration of Horizon Cloud with Splunk needs to be configured. For more information, see Configuring Horizon 8 Edge Monitoring with Splunk Enterprise.
Resource-Monitoring Data: Errors
The Errors section of the Home page lists Horizon Edge errors, pool provisioning errors, single-session VM errors, and multi-session VM errors.
For each resource-error type, the Errors section displays a fraction, for example 2/10, which indicates that two instances of that resource, out of the ten available, are experiencing errors. The following generic example provides more details.
-
Generic Resource-Error Type Example
For example, if the Errors section lists a resource-error type followed by the fraction 2/10, the 2/10 indicates that for the Horizon Edges selected with the Select Horizon Edges filter, ten instances of the respective resource type are available and two of the ten instances are experiencing errors.
Note: The fraction, such as 2/10, gives no indication of the number of errors.
To obtain more details, such as exactly which two resources (for this example) are experiencing errors, the total number of errors, and precisely what the errors are, click the resource-error type link and navigate through the objects on the next page to learn about the various options available to you for that particular resource-error type.
When applicable, the next page includes links to other pages in the Horizon Universal Console or the Omnissa Connect console that might be of use to you.
The following table lists the resource-error types as they appear in the Errors section of the Home page. The table provides specific examples of each resource-error type. The example column includes an example fraction and provides details for that example.
Specific Resource-Error-Type Examples
| Resource-Error Type | Description | Example |
|---|---|---|
| Horizon Edges with infrastructure errors | Horizon Edges experiencing infrastructure errors. These errors do not include Horizon Edge deployment errors.
The Horizon Edges with Infrastructure Errors page includes errors sent from the following components.
| The Horizon Edges with infrastructure errors resource-error type followed by the fraction 2/2. For this 2/2 example, two Horizon Edges are available and both are experiencing errors. To obtain more details, for example the total number of errors and precisely what the errors are, click Horizon Edges with infrastructure errors and navigate through the objects on the page. |
| Pools with provisioning errors | Pools experiencing provisioning errors. | The Pools with provisioning errors resource-error type followed by the fraction 3/16. For this 3/16 example, 16 pools are available and three of those pools are experiencing errors. To obtain more details, for example which pools are experiencing errors, the total number of errors, and precisely what the errors are and when they occurred, click Pools with provisioning errors. You can then navigate through the objects on the page, which includes filtering which pools are displayed on the page. |
| Single-session VMs with agent errors | Single-session VMs that are experiencing agent errors.
In terms of VMs with agent errors, the following error-severity levels apply.
| The Single-session VMs with agent errors resource-error type followed by the fraction 4/34. For this 4/34 example, 34 single-session VMs are available and four of those VMs are experiencing errors. To obtain more details, for example which VMs are experiencing errors, the total number of errors, the severity of each error, the agent version associated with each error, and precisely what the errors are and when they occurred, click Single-session VMs with agent errors and navigate through the objects on the page. Also, the page offers a convenient method for collecting an agent log per error, with the Generate Log option, visible when you click the three vertical dots. For related agent-log information, see Collect Horizon Agent Logs Using the Horizon Universal Console. |
| Multi-session VMs with agent errors | Multi-session VMs that are experiencing agent errors.
In terms of VMs with agent errors, the following error-severity levels apply.
| The Multi-session VMs with agent errors resource-error type followed by the fraction 5/52. For this 5/52 example, 52 multi-session VMs are available and five of those VMs are experiencing errors. To obtain more details, for example which VMs are experiencing errors, the total number of errors, the severity of each error, the agent version associated with each error, and precisely what the errors are and when they occurred, click Multi-session VMs with agent errors and navigate through the objects on the page. Also, the page offers a convenient method for collecting an agent log per error, with the Generate Log option, visible when you click the three vertical dots. For related agent-log information, see Collect Horizon Agent Logs Using the Horizon Universal Console. |
Resource-Monitoring Data: Sessions and VM Performance
The Sessions and VM Performance section of the Home page displays both session data and VM performance data. The section separates session data by session type, such as connected and disconnected, and separates VM data by performance categories, such as high CPU, high disk latency, and high memory. To obtain more details about the type of session or VM performance data listed, click the link to the specific session type or VM-performance-data type you wish to monitor and navigate through the objects on the next page to learn about the various options available to you.
When applicable, the next page includes links to other pages in the Horizon Universal Console or the Omnissa Connect console that might be of use to you.
-
Sessions
The following details apply to the session data available in the Sessions and Performance section.
-
Session types:
-
Connected sessions
Indicates that an end user desktop or app session is connected. Connected sessions include both active and idle sessions.
-
Disconnected sessions
Indicates that an end user desktop or app session is disconnected. A disconnected session differs from a logged-off session in that a disconnected session continues to consume capacity while a logged-off session does not.
-
-
Session fraction example, 5/37 (13%):
The 5/37 (13%) example can apply to both connected sessions and disconnected sessions. To make the example more specific, assume the session is connected. Therefore, of the total capacity of 37 sessions, five are connected (includes active and idle session states), which represents 13% of total capacity.
-
Sessions per pool type:
Clicking a session type brings you to the sessions page for that session type. At the top of the sessions page is a chart that displays the sessions by pool type.
Continuing with the preceding example, where Connected sessions are listed as 5/37, when you click Connected sessions, the connected-sessions page displays a chart illustrating how the five connected sessions are divided among the pool types. The breakdown might be something like the following:
- RDSH Desktops = 2 sessions
- VDI Desktops = 1 session
- RDSH Apps = 2 sessions
-
Session data:
The sessions page also presents a variety of session-related data, such as pool type, session state, username, and login time, among others.
Tip: You can change the way the page presents the session data by using one of the many filters available on the page, such as the Pool Type, Session State, Username, and Horizon Edge filters, among others.
The filters start filtering your input after you enter a minimum of two characters.
-
Log off disconnected sessions:
You can log off disconnected sessions directly from the sessions page.
-
-
VM Performance
The following details apply to the VM performance data available in the Sessions and Performance section.
-
VM performance types:
Tip: For the following VM performances types, you can change the way each page presents the performance data by using one of the filters available on the page, such as the Desktop, Pool, and Horizon Edge filters.
The filters start filtering your input after you enter a minimum of two characters.
-
High CPU VMs
Displays VMs with CPU utilization greater than or equal to 80%.
-
High Disk Latency VMs
Displays VMs with disk latency greater than or equal to 20ms.
-
High Memory VMs
Displays VMs with memory utilization greater than or equal to 80%.
-
-
VM Performance fraction example, 3/42 (7%):
The 3/42 (7%) example applies to all the VM performance types. Of the 42 VMs, three (or 7%) trigger the flag for their respective performance type.
Note: For each VM performance type, if any of the VMs trigger the flag, a color-coded bar accompanies the label that correlates with the respective percentage value as follows.
- 0-60% is green, which might indicate relative safety regarding that performance type. You must determine if the percentage is problematic, given the specifics of your deployment. To make the example more specific, assume the VM Performance type is High CPU VMs. Therefore, 60% or less of the VMs are experiencing CPU utilization greater than 80%.
- 61-80% is yellow, indicating a potential problem regarding that performance type.
- 81-100 is red, indicating that immediate attention is required.
-
Resource-Monitoring Data: Utilization
The Utilization section of the Home page displays the top, or most utilized, three instances of the respective resource.
The following details apply to the Utilization section.
-
In-Use/Maximum Sessions fraction example, 4/42:
The 4/42 example indicates that for the resource types listed in the Utilization section, four sessions are active, idle, or disconnected, while 38 are available but not utilized.
-
Resource types and totals:
The label, Total, that accompanies each of the resources indicates the number of instances of that resource type that are available. For example, "Pool Groups Total 4" indicates that 4 pool groups are available.
Note: The Pool Groups box always applies to all pool groups across all of your Horizon Edges. However, the Pools box and the Unified Access Gateways box apply only to the pool groups and the Unified Access Gateway instances associated with the Horizon Edges selected using the Select Horizon Edges filter on the Home page.
-
Resource instances
-
Each resource box names the three most utilized instances of the given resource type. The box includes a bar chart that presents the number of sessions for each resource instance.
The session metrics for Unified Access Gateways differs from the session metrics for pool groups and pools, as follows.
-
Pool Groups
The session count is the sum of active, idle, and disconnected sessions.
-
Pools
The session count is the sum of active, idle, and disconnected sessions.
-
Unified Access Gateways
The session count is the sum of active and idle sessions.
Tip: Hover the pointer over an instance bar to view session details about that resource instance.
-
-
Was this page helpful?