Use the enhanced OS Crash Analysis feature in your Omnissa Workspace ONE Experience Management for Windows and Horizon environment to help capture root cause events as opposed to capturing events at the kernel level. This feature is activated by default.
Device data collected
The Experience Management for Windows and Horizon agent collects the listed attributes for the OS Crash Analysis feature using the ExternalDumpAnalyzer process, which is included in the agent.
| Column | Attribute | Data Category | Data Description | Related Events |
|---|---|---|---|---|
| Complete Stack Trace | complete_stack_trace | Device diagnostics / crash diagnostic data | Full stack trace captured from OS crash dump analysis. This is a text field and may contain multiple stack frames used to diagnose the system crash. | System Crash from DeviceEventTracker |
| Caused By Module | caused_by_module | Device diagnostics / crash diagnostic data | Module or driver identified by dump analysis as associated with the crash cause, for example a .dll, .sys, or module name. This is a string field. | System Crash from DeviceEventTracker |
| Process Associated With | process_associated_with | Device diagnostics / crash diagnostic data | Process name associated with the system crash as determined from dump analysis. This is a string field. | System Crash from DeviceEventTracker |
Requirements
Ensure you have met the listed requirements before you deploy the enhanced OS Crash Analysis feature to Windows devices.
- Use the Experience Management for Windows and Horizon agent 26.07 or later.
- Ensure the device's symbol cache directory is writable by the
Workspace ONE Endpoint Telemetryservice account. - Ensure the device can reach the Microsoft public symbol server at
http://msdl.microsoft.com/download/symbolsdirectly or through the configured proxy. - Install and use WinDbg on the device.
- Use system-level environment variables for service scenarios.
- Restart the
Workspace ONE Endpoint Telemetryservice or reboot it after changing system-level environment variables.
How does the feature work?
When Experience Management detects a Windows OS crash dump, the DeviceEventTracker launches the ExternalDumpAnalyzer process (ws1dumpa.exe). There are two modes of OS crash analysis: IPC (Inter-Process Communication) mode and Standalone mode.
IPC mode
- When a Windows OS crash happens and the system detects an OS crash dump, the DeviceEventTracker launches the ExternalDumpAnalyzer process from
C:\Program Files\WorkspaceONE\Endpoint Telemetry\Tools\ws1dumpa.exe. - The crash dump path is passed as an argument to the process.
- Before analysis begins, ws1dumpa.exe performs the following validations.
- The request is running with SYSTEM or Administrator privileges.
- The dump file exists.
- Debugger tools are available.
- Network connectivity is available.
- If any of the validations fail, the system logs an appropriate warning or error message.
- After validation, the ExternalDumpAnalyzer process performs the listed steps.
- Uses the installed debugger to analyze the dump.
- Generates crash analysis results.
- Reports the results back to the telemetry service.
- The analyzer output includes the following enriched crash fields.
process_associated_withcaused_by_modulecomplete_stack_trace
Debugger Fallback
If the debugger tools are not available, the analyzer falls back to the inbox debugger. It uses the inbox Windows debug helpers with the symbol options for crash dump details, minimal process, module information, and complete_stack_trace. The complete_stack_trace symbol options are helpful for analysis.
Symbol Resolution
- If network connectivity is available, the system can download matching symbols from the symbol server. WinDbg uses these symbols for accurate analysis.
- When the network is unavailable but the required symbols are already present in the local cache, the analyzer can use them.
Analysis Fallback
If external analysis fails for any reason, the DeviceEventTracker falls back to an in-process dump analysis. It uses the inbox Windows debug helpers with the symbol options for crash dump details, minimal process, module information, and complete_stack_trace. The complete_stack_trace symbol options are helpful for analysis.
Finally, the system generates the system_crash event and sends it along with these enriched attributes to Experience Management.
Standalone mode
You can also execute the ExternalDumpAnalyzer process independently by providing a dump file as an argument.
- Open Command Prompt as an Administrator.
- Run the following command
C:\Program Files\WorkspaceONE\Endpoint Telemetry\Tools\ws1dumpa.exe "dumpfilepath".
Behavior
- All validations and analysis functionality are identical to IPC mode.
- Analysis results are displayed directly in Command Prompt.
- Results are not sent to Intelligence or Experience Management services.
- This mode is primarily intended for troubleshooting and validation purposes.
Install and use WinDbg on the device
The ExternalDumpAnalyzer process uses the Microsoft Debugging Engine to load the OS crash dump, resolve symbols, and produce crash analysis fields like stack trace and the caused-by module. Use WinDbg as the debugger because it is built on top of the Microsoft Debugger Engine and gives full access to OS crash analysis.
Order of searches
The ExternalDumpAnalyzer process searches the Microsoft Debugging Engine components in the listed order.
- Windows SDK Debugging Tools paths, such as
C:\\Program Files (x86)\\Windows Kits\\10\\Debuggers\\x64- If it does not find anything, it tries the next search location.
- Microsoft Store WinDbg package paths under
C:\\Program Files\\WindowsApps\\Microsoft.WinDbg_*- If it does not find anything, it tries the next search location.
- The system
dbgeng.dll
WindDbg Installation methods
You can install WinDbg using two methods: The Microsoft Store or the Windows SDK.
Run the installation command in the device context used by the deployment system and validate the installed path before activating enhanced OS Crash Analysis broadly.
- Microsoft Store installation
- You can install WinDbg using the command line as an administrator with the WinGet package manager and the listed command.
winget install --id Microsoft.WinDbg --source msstore --accept-package-agreements --accept-source-agreements- Use the Software Distribution (SFD) feature in Workspace ONE UEM to push the command to devices.
- Windows SDK installation
- Use the Windows SDK and its corresponding Windows SDK Debugging Tools if your organization blocks the use of app stores.
- Make sure that the dbgeng.dll system file resides in one of these listed paths.
- C:\Program Files (x86)\Windows Kits\10\Debuggers\x64
- C:\Program Files (x86)\Windows Kits\10\Debuggers\arm64
- C:\Program Files (x86)\Windows Kits\10\Debuggers\x86
Where is the ExternalDumpAnalyzer process?
The ExternalDumpAnalyzer process resides on the device at the listed path.
Computer\HKEY_LOCAL_MACHINE\SOFTWARE\WorkspaceONE\Endpoint Telemetry\Service\Config\ExternalDumpAnalyzer\Enabled
You can change the key-value pair in the device registry to false to deactivate the enhanced OS Crash Analysis feature.
| Key Name | Value | Description |
|---|---|---|
| Enabled | true | The ExternalDumpAnalyzer is activated. |
| Enabled | false | The ExternalDumpAnalyzer is deactivated. |
Script for deactivation
If you don't want to manually deactivate the key-value pair, you can create your own PowerShell script, for example name the file Set-ExternalDumpAnalyzer.ps1, for remote or mass deactivation instead of manually editing the registry key.
.\Set-ExternalDumpAnalyzer.ps1— activates the feature (Enabled = "true").\Set-ExternalDumpAnalyzer.ps1 -Disable— deactivates the feature (Enabled = "false").\Set-ExternalDumpAnalyzer.ps1 -Remove— removes the key entirely (reverts to default)
Note: Ensure you run the script with Administrator/SYSTEM privileges, as it writes to HKLM.
#Requires -RunAsAdministrator
<#
.SYNOPSIS
    Enables, disables, or removes the DEEM / Endpoint Telemetry
    "ExternalDumpAnalyzer" registry setting, for remote/mass deployment.

.DESCRIPTION
    Target key:
        HKLM\SOFTWARE\WorkspaceONE\Endpoint Telemetry\Service\Config\ExternalDumpAnalyzer

    Actions:
      (default)   Set  "Enabled" = "true"    -> feature enabled
      -Disable    Set  "Enabled" = "false"   -> feature disabled
      -Remove     Delete the ExternalDumpAnalyzer key entirely
                  -> agent falls back to its default (disabled)

    Notes:
    - "Enabled" is a STRING (REG_SZ) "true"/"false", matching the admin guide and
      the agent config option ExternalDumpAnalyzer/Enabled (bool, default false).
    - Creates the key path if it does not exist (enable/disable).
    - Always targets the 64-bit registry view, so it works even if invoked by a
      32-bit deployment host (avoids WOW6432Node redirection).
    - Intended for Workspace ONE UEM scripts, Intune, GPO startup scripts, or
      PowerShell Remoting (Invoke-Command).

.PARAMETER Disable
    Disable the feature (sets Enabled = "false"). Omit to enable ("true").

.PARAMETER Remove
    Remove the ExternalDumpAnalyzer key from the registry (reverts to default).

.EXAMPLE
    .\Set-ExternalDumpAnalyzer.ps1
    Enables ExternalDumpAnalyzer (Enabled = "true").

.EXAMPLE
    .\Set-ExternalDumpAnalyzer.ps1 -Disable

.EXAMPLE
    .\Set-ExternalDumpAnalyzer.ps1 -Remove

.NOTES
    Exit codes: 0 success | 1 general failure | 2 verification failed |
                5 not elevated
#>
[CmdletBinding(DefaultParameterSetName = 'Set')]
param(
    [Parameter(ParameterSetName = 'Set')]
    [switch]$Disable,

    [Parameter(ParameterSetName = 'Remove')]
    [switch]$Remove
)

$ErrorActionPreference = 'Stop'

$subKeyPath = 'SOFTWARE\WorkspaceONE\Endpoint Telemetry\Service\Config\ExternalDumpAnalyzer'
$valueName  = 'Enabled'

function Test-IsAdministrator {
    $identity  = [Security.Principal.WindowsIdentity]::GetCurrent()
    $principal = New-Object Security.Principal.WindowsPrincipal($identity)
    return $principal.IsInRole([Security.Principal.WindowsBuiltInRole]::Administrator)
}

try {
    if (-not (Test-IsAdministrator)) {
        Write-Error 'Must be run as Administrator (writes to HKLM).'
        exit 5
    }

    # Open the 64-bit HKLM view explicitly (robust to 32-bit callers).
    $base = [Microsoft.Win32.RegistryKey]::OpenBaseKey(
        [Microsoft.Win32.RegistryHive]::LocalMachine,
        [Microsoft.Win32.RegistryView]::Registry64)

    if ($Remove) {
        # ---- Remove the ExternalDumpAnalyzer key entirely ----
        $existing = $base.OpenSubKey($subKeyPath)
        if ($null -eq $existing) {
            Write-Output "ExternalDumpAnalyzer key not present; nothing to remove."
            Write-Output "Key: HKLM\$subKeyPath"
            $base.Close()
            exit 0
        }
        $existing.Close()

        $base.DeleteSubKeyTree($subKeyPath)

        # Verify removal.
        $check = $base.OpenSubKey($subKeyPath)
        $base.Close()
        if ($null -ne $check) {
            $check.Close()
            Write-Error "Verification failed: key still present at HKLM\$subKeyPath"
            exit 2
        }

        Write-Output "ExternalDumpAnalyzer REMOVED from registry (agent reverts to default: disabled)."
        Write-Output "Key: HKLM\$subKeyPath"
        exit 0
    }

    # ---- Enable / Disable ----
    $desired   = if ($Disable) { 'false' } else { 'true' }
    $stateText = if ($Disable) { 'DISABLED' } else { 'ENABLED' }

    # CreateSubKey creates the full path if missing and opens it writable.
    $key = $base.CreateSubKey($subKeyPath)
    if ($null -eq $key) {
        Write-Error "Failed to open/create registry key: HKLM\$subKeyPath"
        exit 1
    }

    # Value is a REG_SZ string "true"/"false".
    $key.SetValue($valueName, $desired, [Microsoft.Win32.RegistryValueKind]::String)

    # Verify the written value.
    $actual = $key.GetValue($valueName)
    $key.Close()
    $base.Close()

    if ($actual -ne $desired) {
        Write-Error "Verification failed: $valueName = '$actual' (expected '$desired')."
        exit 2
    }

    Write-Output "ExternalDumpAnalyzer $stateText  ($valueName = `"$actual`")"
    Write-Output "Key: HKLM\$subKeyPath"
    exit 0
}
catch {
    Write-Error "Failed to update ExternalDumpAnalyzer: $($_.Exception.Message)"
    exit 1
}
Policies for symbol related settings
You can configure some policies to define symbol related settings. The policies are under Workspace ONE Endpoint Telemetry > DEEM > Symbol Store Settings.
The registry key that the policy uses is the Symbol Store Settings policy located at
HKLM\Software\Policies\WorkspaceONE\Endpoint Telemetry\DEEM\Symbol Store Settings, and it includes 5 symbol registry policy files to configure.
- Local symbols
- Configures which symbol variables to use.
- These settings impact the Microsoft Symbols, the Alternative Symbols, and the Symbol Proxy registry files.
- True = local symbol variables
- In the
Symbol Store Settingspolicy, configure theUseLocalSymbolConfigurationastrueto set the ExternalDumpAnalyzer process to use the local symbol variables. - At least one of these local symbol variables must be configured on the device.
_NT_SYMBOL_PATH_NT_ALT_SYMBOL_PATH_NT_SYMBOL_PROXY
- If none of these local symbol variables is configured on the device, the ExternalDumpAnalyzer process can use the default-managed symbol cache.
- If you set this policy as true, the system ignores the Microsoft Symbols, the Alternative Symbols, and the Symbol Proxy registry files.
- In the
- False = policy values or default-managed symbol variables
- In the
Symbol Store Settingspolicy, configure theUseLocalSymbolConfigurationasfalseto set the ExternalDumpAnalyzer process to use either policy values or the default-managed symbol variables. - The system prefers to use policy values if they are present. If policy values are not set on the device, than the system uses the managed-default values.
- In the
- Microsoft Symbols
- Configures the Microsoft symbol path and the local cache location.
- The registry value is
MicrosoftSymbols. - The default when this is not configured is
srv*C:\ProgramData\WorkspaceONE\ws1etlm\MSSymbols*http://msdl.microsoft.com/download/symbols. - An example custom cache is
srv*C:\Symbols*http://msdl.microsoft.com/download/symbols. - If you configure
UseLocalSymbolConfigurationastrue, the system ignores this registry file.
- Alternative Symbols
- Configures an additional symbol path that is equivalent to the path
_NT_ALT_SYMBOL_PATH. - The registry value is
AlternativeSymbols. - The system searches this path before it searches the Microsoft Symbols path.
- An example is
C:\PrivateSymbols. - If you configure
UseLocalSymbolConfigurationastrue, the system ignores this registry file.
- Configures an additional symbol path that is equivalent to the path
- Symbol Proxy
- Configures the symbol proxy equivalent to
_NT_SYMBOL_PROXY. - The registry value is
SymbolProxy. - An example is
http://proxy.example.com:8080. - If you configure
UseLocalSymbolConfigurationastrue, the system ignores this registry file.
- Configures the symbol proxy equivalent to
- Delete Symbols
- Configures how long the managed local symbol cache is retained before deletion.
- The registry value is
DeleteSymbolsKeepHours. - It is best to associate the cleanup timer to the configured retention schedule.
- If the device downloaded symbols already in the past and a cleanup is due soon or is overdue, delay this registry by 15 to 25 minutes after boot (which happens after a crash).
- If a cleanup is due later on the device, set the timer for that retention period, plus 15 to 25 minutes. This timer ensures that the cleanup doesn’t run right at startup and doesn’t interfere with crash dump analysis.
- Allowed values include
Minimum: 1 hour,Maximum: 720 hours, andDefault: 168 hours. There are 168 hours in seven days.
Configure symbol policies
Select from two methods to activate and deploy the enhanced OS Crash Analysis feature. Use PowerShell commands or use Group Policy Objects (GPOs).
- PowerShell
- Using registry policies, write directly to the policy registry key.
- This method is useful if you use the Software Distribution (SFD) feature to push commands to devices and you do not use GPOs.
- This method requires WinDbg on devices.
- Group Policy Objects
- Configure the symbol registry policy files in the Group Policy Management Editor.
- Use the ADMX and ADML templates to deploy the symbol policies from the Group Policy Management Console at the domain GPO level.
- The GPO writes the same registry-backed policy values on target devices.
- This method is useful if you use GPOs to manage devices and you do not use the SFD.
Powershell method
If you use the SFD feature to push commands to devices, add the necessary symbol registry policy files and adjust the values of respective policies according to your needs.
Important: Restart the Workspace ONE Endpoint Telemetry service or reboot the device after changing machine environment variables because Windows services read environment variables when the service process starts.
Examples
Listed are some examples of symbol registry policy files.
Default-managed symbol cache
Defines the default-managed symbol cache.
$policyPath = "HKLM:\Software\Policies\WorkspaceONE\Endpoint Telemetry\DEEM\Symbol Store Settings"
New-Item -Path $policyPath -Force | Out-Null

New-ItemProperty -Path $policyPath -Name "UseLocalSymbolConfiguration" -PropertyType String -Value "false" -Force | Out-Null
New-ItemProperty -Path $policyPath -Name "MicrosoftSymbols" -PropertyType String -Value "srv*C:\ProgramData\WorkspaceONE\ws1etlm\MSSymbols*http://msdl.microsoft.com/download/symbols" -Force | Out-Null
New-ItemProperty -Path $policyPath -Name "DeleteSymbolsKeepHours" -PropertyType DWord -Value 168 -Force | Out-Null
Custom symbol cache
Defines the custom symbol cache.
$policyPath = "HKLM:\Software\Policies\WorkspaceONE\Endpoint Telemetry\DEEM\Symbol Store Settings"
New-Item -Path $policyPath -Force | Out-Null

New-ItemProperty -Path $policyPath -Name "UseLocalSymbolConfiguration" -PropertyType String -Value "false" -Force | Out-Null
New-ItemProperty -Path $policyPath -Name "MicrosoftSymbols" -PropertyType String -Value "srv*C:\Symbols*http://msdl.microsoft.com/download/symbols" -Force | Out-Null
New-ItemProperty -Path $policyPath -Name "AlternativeSymbols" -PropertyType String -Value "C:\PrivateSymbols" -Force | Out-Null
New-ItemProperty -Path $policyPath -Name "SymbolProxy" -PropertyType String -Value "http://proxy.example.com:8080" -Force | Out-Null
New-ItemProperty -Path $policyPath -Name "DeleteSymbolsKeepHours" -PropertyType DWord -Value 168 -Force | Out-Null
Local symbol environment variables
Defines the local symbol environment variables. Use this configuration when you want the ExternalDumpAnalyzer process to use local symbol environment variables instead of policy symbol values.
$policyPath = "HKLM:\Software\Policies\WorkspaceONE\Endpoint Telemetry\DEEM\Symbol Store Settings"
New-Item -Path $policyPath -Force | Out-Null
New-ItemProperty -Path $policyPath -Name "UseLocalSymbolConfiguration" -PropertyType String -Value "true" -Force | Out-Null

[Environment]::SetEnvironmentVariable("_NT_SYMBOL_PATH", "srv*C:\Symbols-check*http://msdl.microsoft.com/download/symbols", "Machine")
[Environment]::SetEnvironmentVariable("_NT_ALT_SYMBOL_PATH", "C:\PrivateSymbols", "Machine")
[Environment]::SetEnvironmentVariable("_NT_SYMBOL_PROXY", "http://proxy.example.com:8080", "Machine")
GPOs method
Configure the policies in the Group Policy Management Editor and use the ADMX and ADML template files so that the policies are available in the Group Policy Management Console at the domain GPO level for deployment.
Configure the ADMX and ADML templates
Configure the ADMX and the ADML templates in the domain GPO policy to deploy the enhanced OS Crash Analysis settings to your fleet of Windows devices.
Prerequisites
If you have not retrieved the etlm_extra_bundle from Customer Connect, retrieve it now because it includes the ADMX and the ADML templates, which are bundled in the Workspace ONE Endpoint Telemetry agent ZIP file.
Procedure
- Copy
wsone_etlm.admxto the domain Central Store.\\<domain>\SYSVOL\<domain>\Policies\PolicyDefinitions\wsone_etlm.admx - Copy
wsone_etlm.admlto the matching language folder.\\<domain>\SYSVOL\<domain>\Policies\PolicyDefinitions\en-US\wsone_etlm.adml - Open the Group Policy Management Console on the Windows device.
- Edit the target device policy.
- Go to Computer Configuration > Administrative Templates > Workspace ONE Endpoint Telemetry > DEEM > Symbol Store Settings.
- Configure the appropriate symbol policies from the five available options (local symbols, Microsoft symbols, alternative symbols. symbol proxy, and delete symbols) according to your specific needs.
- Apply the policy to target devices.
- Run
gpupdate /forceor wait for normal policy refresh.
Add crash diagnostics to reports and dashboards
After the enhanced OS Crash Analysis feature reports enriched crash diagnostic fields, you can add those fields as columns to any report and to dashboard widgets to analyze crash root causes across your fleet, without leaving the Intelligence reporting workflow you already use.
Reports
- In Intelligence, go to Workspace > Reports.
- Open the report that lists the System Crash events.
- Select Manage columns to add Stack Trace, Complete Stack Trace, Caused By Module, and Process Associated With from the column list.
- Save the report.
The report table now displays the selected diagnostic columns for each crash event.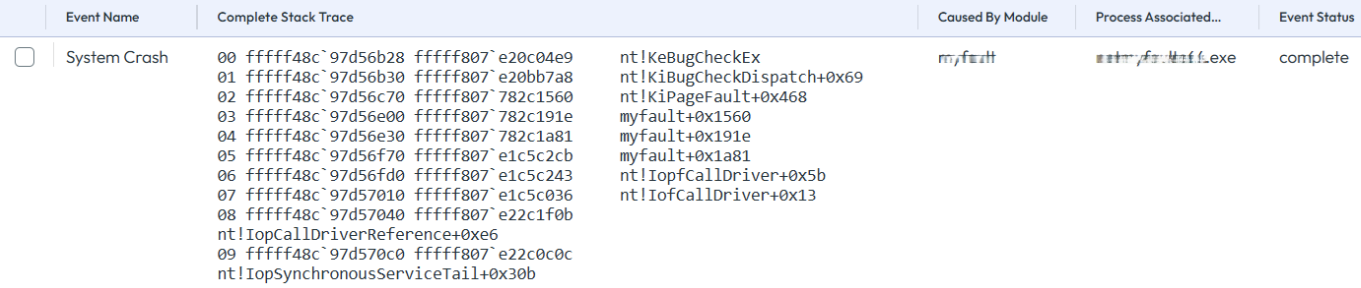
Dashboard widgets
- In Intelligence, go to Workspace > Dashboards.
- Add the widget to an existing dashboard or create a custom dashboard.
- Select Employee Experience > Devices as the data source.
- You can leave all the required entries as the default.
- In the Filter area, choose the attribute Event Name Equals System Crash.
- Save the widget.
- Use the Manage columns menu option in the widget to add the columns for Stack Trace, Caused By Module, and Process Associated With.
Add the information as fields or you can add them as grouping dimensions if that meets your use case.
Was this page helpful?