Easily turn the sending and displaying of telemetry data off or on for your Omnissa Workspace ONE Experience Management for Horizon deployment using the toggle menu option for an entire organization, a single edge, or multiple edges in your Horizon deployment. Access these settings in Omnissa Intelligence.
Requirements
You must use the listed agent versions for Horizon Advanced Telemetry to work.
- Use the Workspace ONE Experience Management for Windows and Horizon agent 2412 or later.
- Use the Horizon Agent 2412 or later.
Procedure
Activate the sending and displaying of Horizon data at the organization level or at the edge level.
You can use a custom dashboard and widgets to verify your Horizon Advanced Telemetry settings. For details on how to create custom dashboards, see How do you create a custom dashboard.
- In Intelligence, go to Workspace > Experience Management > Settings, select the Virtual Destops and Apps tab, and edit it.
- In the Virtual Session Telemetry window, activate the feature, Enabled Horizon Advanced Telemetry.
- By default, the feature is activated to send and display data for the entire organization.
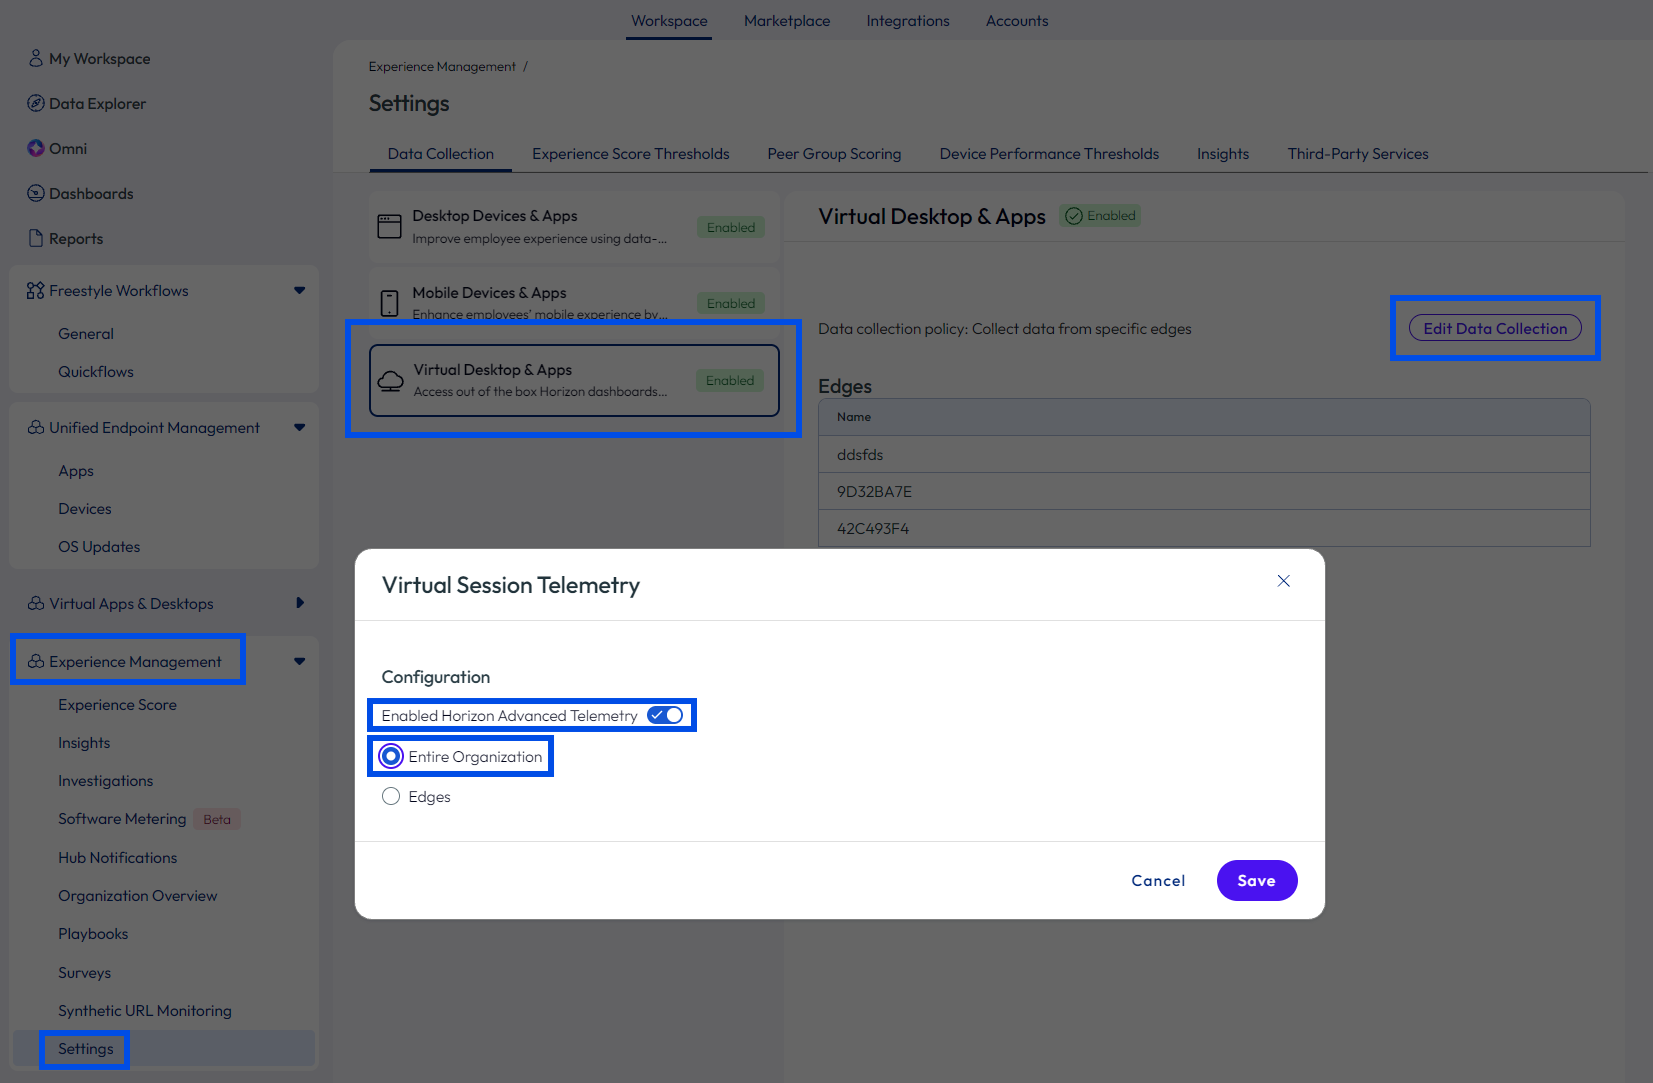
- By default, the feature is activated to send and display data for the entire organization.
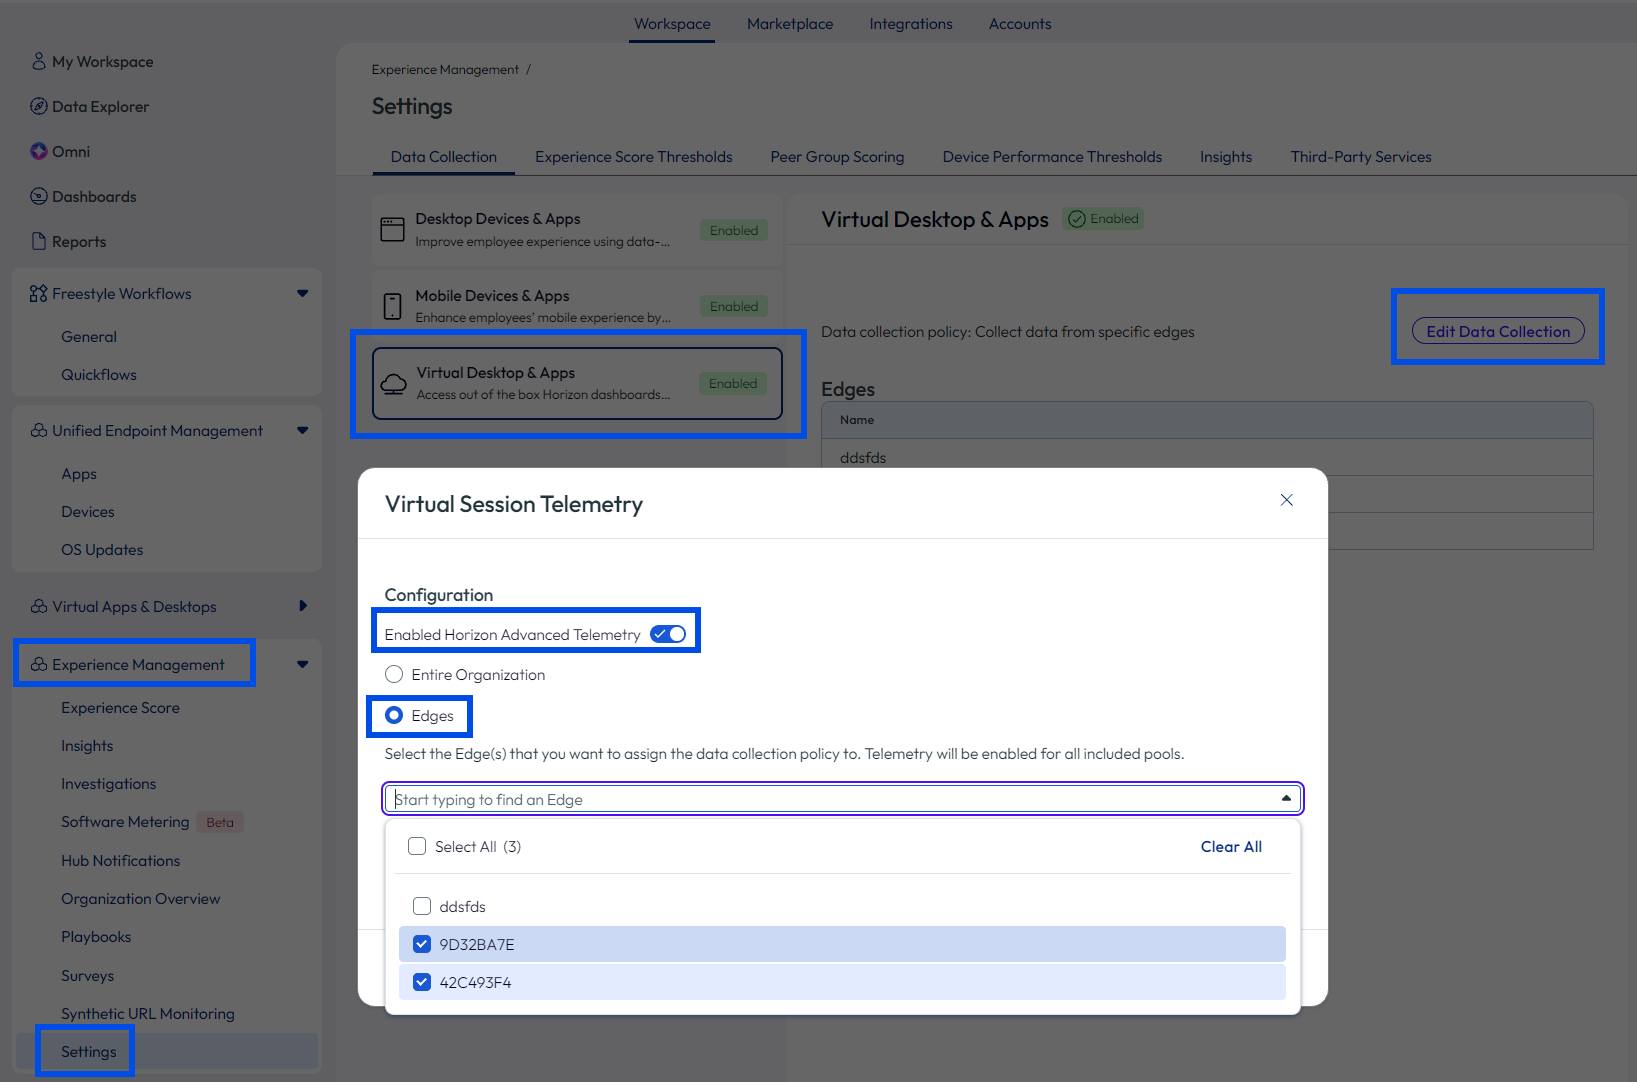
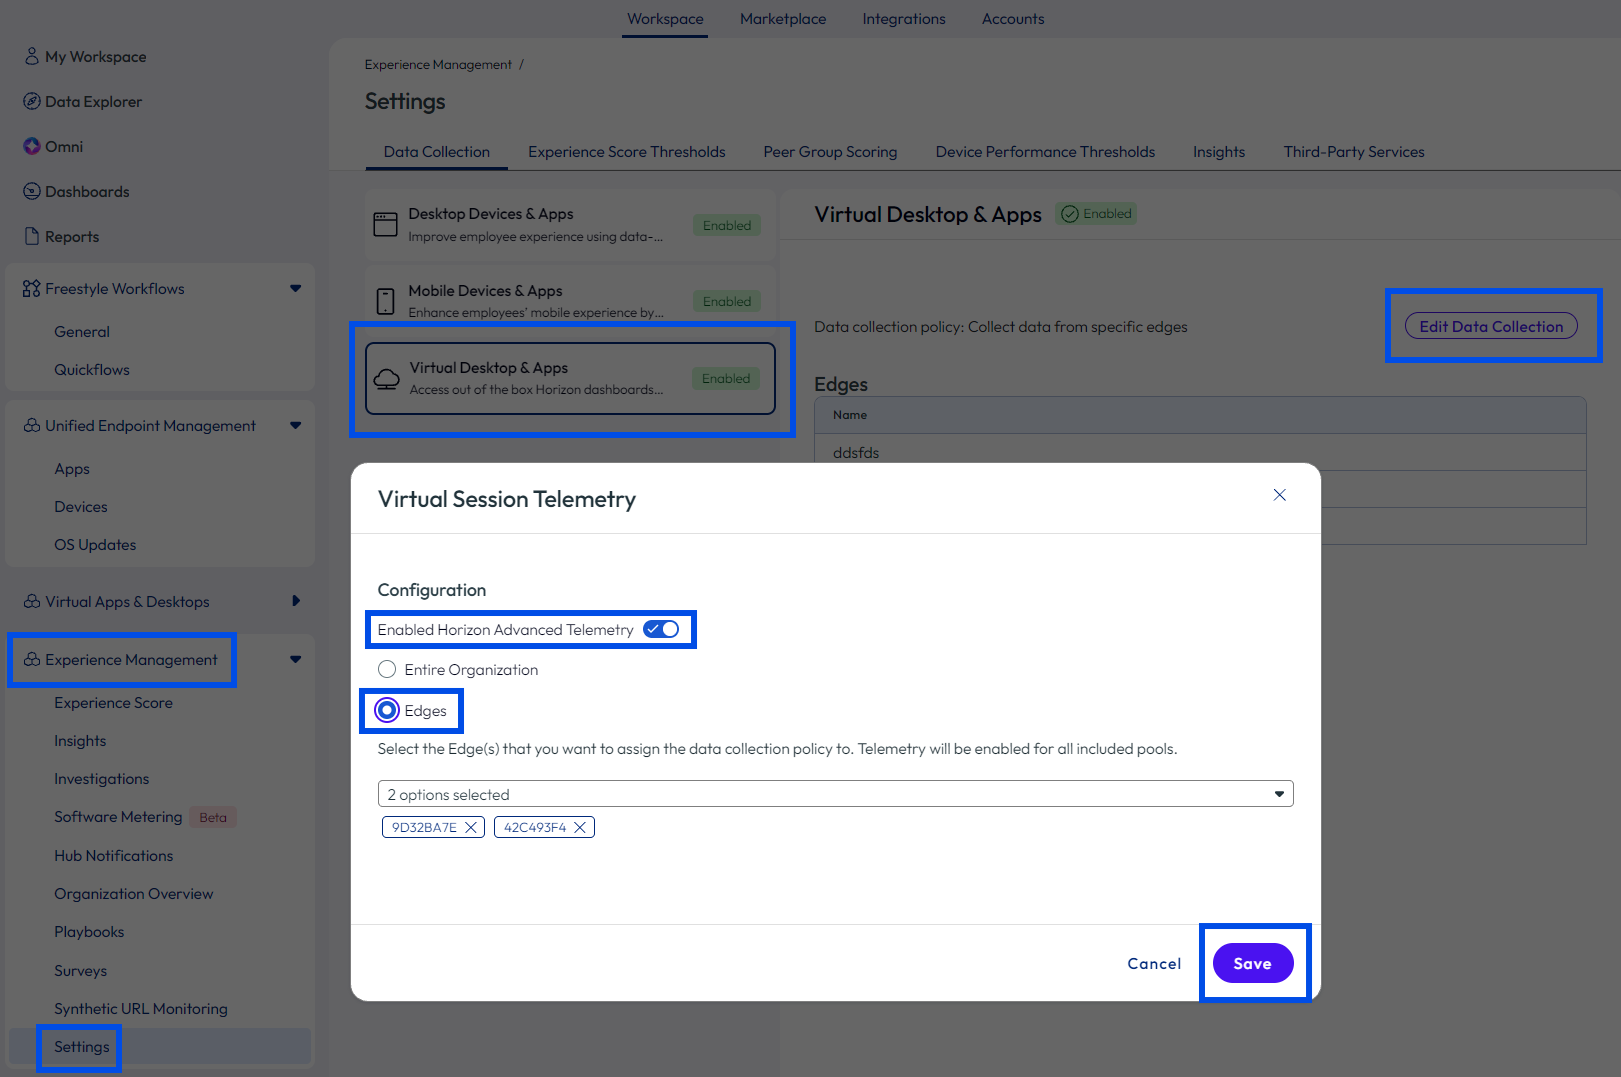
- You can change this setting to Edges by selecting all edges, a single edge, or multiple edges.
- Save your settings.
Verify settings
Verify Horizon Advanced Telemetry settings using a custom widget by adding one to an existing Horizon dashboard or creating a custom dashboard and adding a widget to it.
- Name the widget so you can identify it. For example, you can name it
Dynamic Cloud Edge. - For the Data Source select Employee Experience > Apps (Horizon).
- For the required section, listed are some suggested settings.
- Chart Type: Vertical
- Count of Device > Device Name
- Group By Device > Device Name
- Results per group: 10
- Data Range: Last 7 days
- Frequency: 1 day
- For the Filter section, select Device Name Includes
<name of the edge>. - Look for data in the dashboard by finding the visualization for the widget.
- If you activated to display data, you see a vertical bar representing data for the last 7 days for the edges you activated.
- If you deactivated displaying data, you can filter the widget for more than 7 days and see that the data is missing for the edges you deactivated.
Was this page helpful?