Omnissa Workspace ONE Experience Management offers Device Timelines to help you troubleshoot issues on your Omnissa Workspace ONE UEM-managed devices or on devices managed by third-party unified endpoint management systems. See a device's actions and issues visualized in Omnissa Intelligence in real-time or over longer periods of time and remediate these issues by device.
Required subscriptions
To use device timelines, you must have the Workspace ONE Experience Management subscription.
Supported platforms
Device timelines display metrics for macOS and Windows devices.
Use cases
Use device timelines to help with the listed Support and Service Desk use cases.
- Search for and find a device and view its details in seconds.
- Discover when issues occur, down to the second, and troubleshoot what is causing these issues. Also, discover if issues on a device are trending over time.
- Correlate many data points on a screen simultaneously to find the root cause of an issue.
- Customize the order of event data based on the cause.
- Summarize all of a user's issues and view the issues within seconds and troubleshoot why the user is having a bad experience.
- Quickly filter all occurrences of a device issue to view an issue list and use the event log.
- After finding an issue on a device, remediate the issue.
Navigation
You have several avenues to find a device timeline. Use the search feature, use the Experience Score Contributor dashboard, or use the Data Explorer.
Search
Use the Search feature if you know the user's name or the name of the device and you need to find the issue fast.
- At the top of the Intelligence UI, place your curser in the Search text field.
- Select the Devices tab or the User tab depending on the information you have.
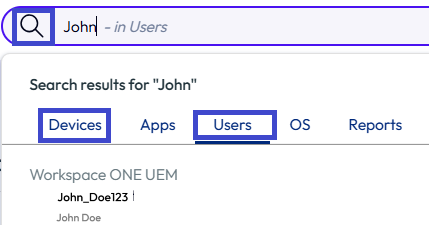
- Enter the applicable information.
- Device tab: Select the applicable device and land in the device timeline.
- Users tab: Select the applicable user and on the Overview tab, select the device from the Associated Devices section.
Experience Score Contributor dashboard
Use any of the Experience Score contributor dashboards if you know of a company wide issue. 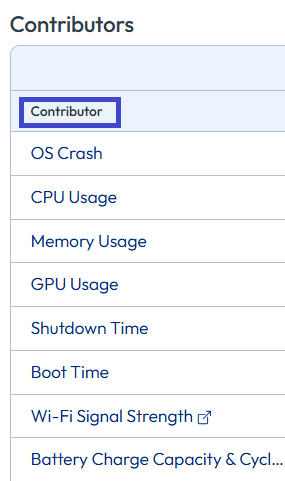
As an example, let's look at an OS Crash issue and find the device that is having the most OS crashes.
- In the Intelligence UI, on the Workspace tab, go to Experience Management > Experience Score.
- On the Physical tab, select the Devices tile.
- Select Windows or MacOS depending on the device, and look at the Contributor table.
- Select the OS Crash contributor.
- Scroll to the Impacted Devices list and ensure the arrow is pointing downward in the OS Crash column. This filter puts the most impacted device at the top of the table.
- In the Device Name column, select the top device and see its timeline.

Data Explorer and Search
Use the Data Explorer if you want to research an issue by creating a query to browse through a list of devices having the issue. After creating a query, you can select a device in the Data Explorer query result. Find for the device using the Search feature to select it and access its timeline.
Tabs
When you navigate to the a device timeline, access information on the tabs to help research and troubleshoot events.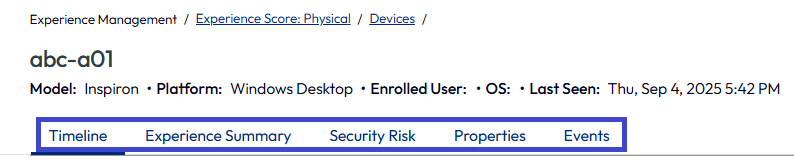
Timeline
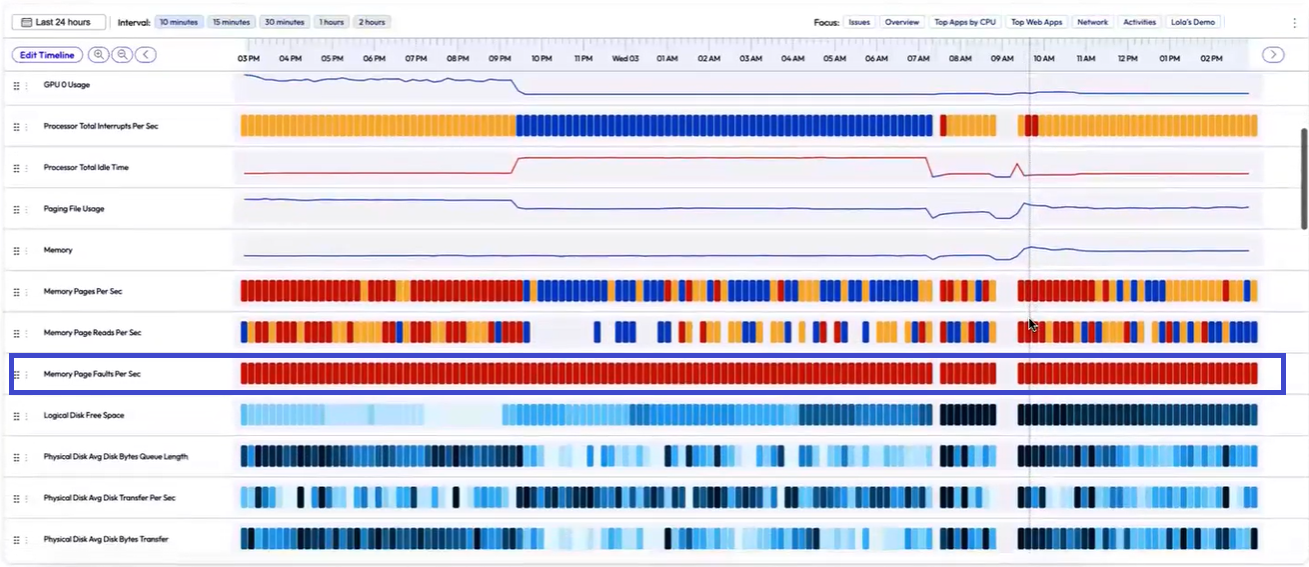
Use this tab for predefined views that visualize events. Also, create customized Saved views that you can use to meet your researching activities.
- The views you save persist and you can manage them.
- Add event rows.
- Add more metrics to events rows.
- See time series data for events (as dots), performance percentages (as lines), and performance integers (as 1 to the Nth ranges).
- Customize the date range to see issue details.
- See real-time data (Last 4 hours) or see data over a time interval (Last 14 days).
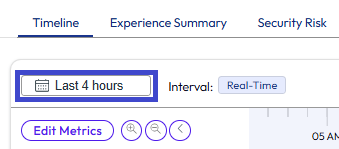
- Interact with data by hovering over data points and using the breadcrumb trail in the right side tray.
- See real-time data (Last 4 hours) or see data over a time interval (Last 14 days).
Experience Summary
Use this tab to see the Experience Score Breakdown and to view the metrics that triggered the score.
- View scores and data that the system aggregates over longer time periods. Customize the time period to help with researching issues.
- For example, find out why an Experience Score is neutral or poor. Use the Experience Score Breakdown.
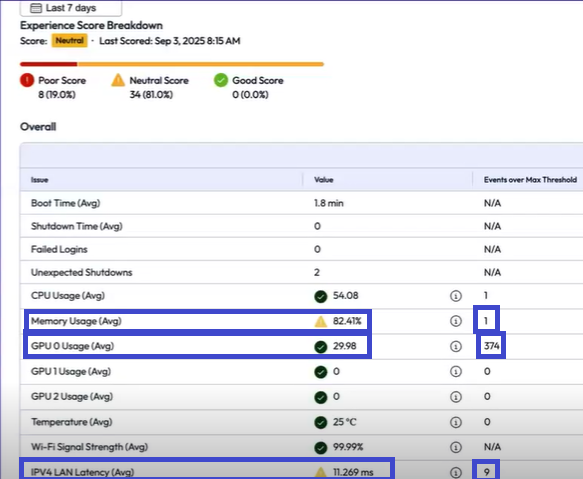
- In the screenshot example, over 7 days, this device had an 82.41% neutral experience for Memory Usage (Avg). This device also had a neutral IPV4 LAN Latency (Avg) experience.
- The Memory Usage on this device exceeded the maximum threshold one time. The IPV4 LAN Latency exceeded the maximum threshold 9 times.
- Although, the GPU 0 Usage (Avg) exceeded the maximum threshold 374 times, the experience score remained Good. These spikes in use (for example, graphics processing or watching media) did not negatively impact the score and did not cause a sustaining issue.
- Consider changes to enhance the Memory Usage and the Latency on this device to improve its experience.
- For example, find out why an Experience Score is neutral or poor. Use the Experience Score Breakdown.
- Thresholds are pre-defined as Poor (red), Neutral (yellow), and Good (green) but you can adjust the thresholds.
Security Risk
Use this tab for a list of the possible risks associated with the device. The Intelligence risk analytics feature tracks user and device actions and behaviors and then calculates the potential risk.
Properties
Use this tab to see the current state data of the device and the user. Find metrics for hardware, storage, battery, USB and PCI devices, drivers, and network interfaces in the User, Storage, Drivers, and Hardware tabs.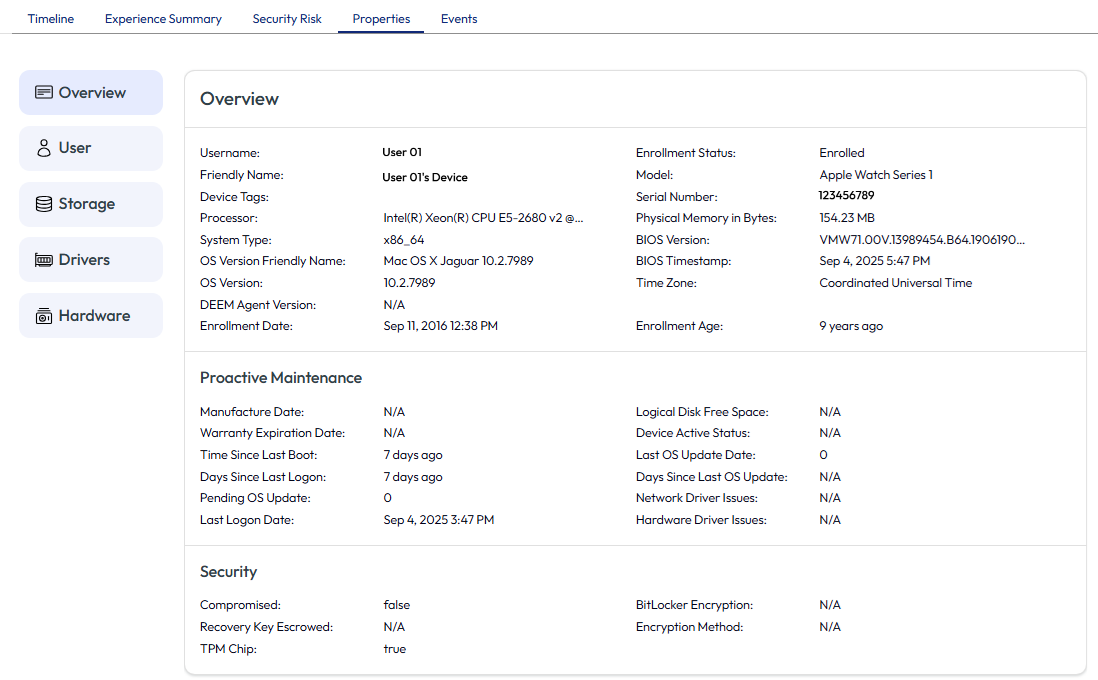
Event Log
Use this tab to see a list of issues as a report or quick reference during research.
- Use the Filters to customize the list and to display data specific to your research.
- Events in this log are specific to Experience Management and are not associated with other Omnissa products at this time.
How to interact with data
Interact with device timelines by hovering over data points for quick reference information or by selecting data points to access event breadcrumb trails.
Network connectivity map views
Use the network connectivity map view to get a visual line of site to a device's connectivity. This view also offers information about the device like its CPU processor, OS version, device model, and total memory.
To access the view, work in a device session timeline.
- In the device session timeline, go to a network metric, like Wi-Fi Signal Strength, and look for a red marker in the bar graph.
- Select the red marker, which is identifying low wi-fi signal strength, to display and expand the network connectivity map view in the right tray.
- You can select any marker, no matter the color, to open the map view.
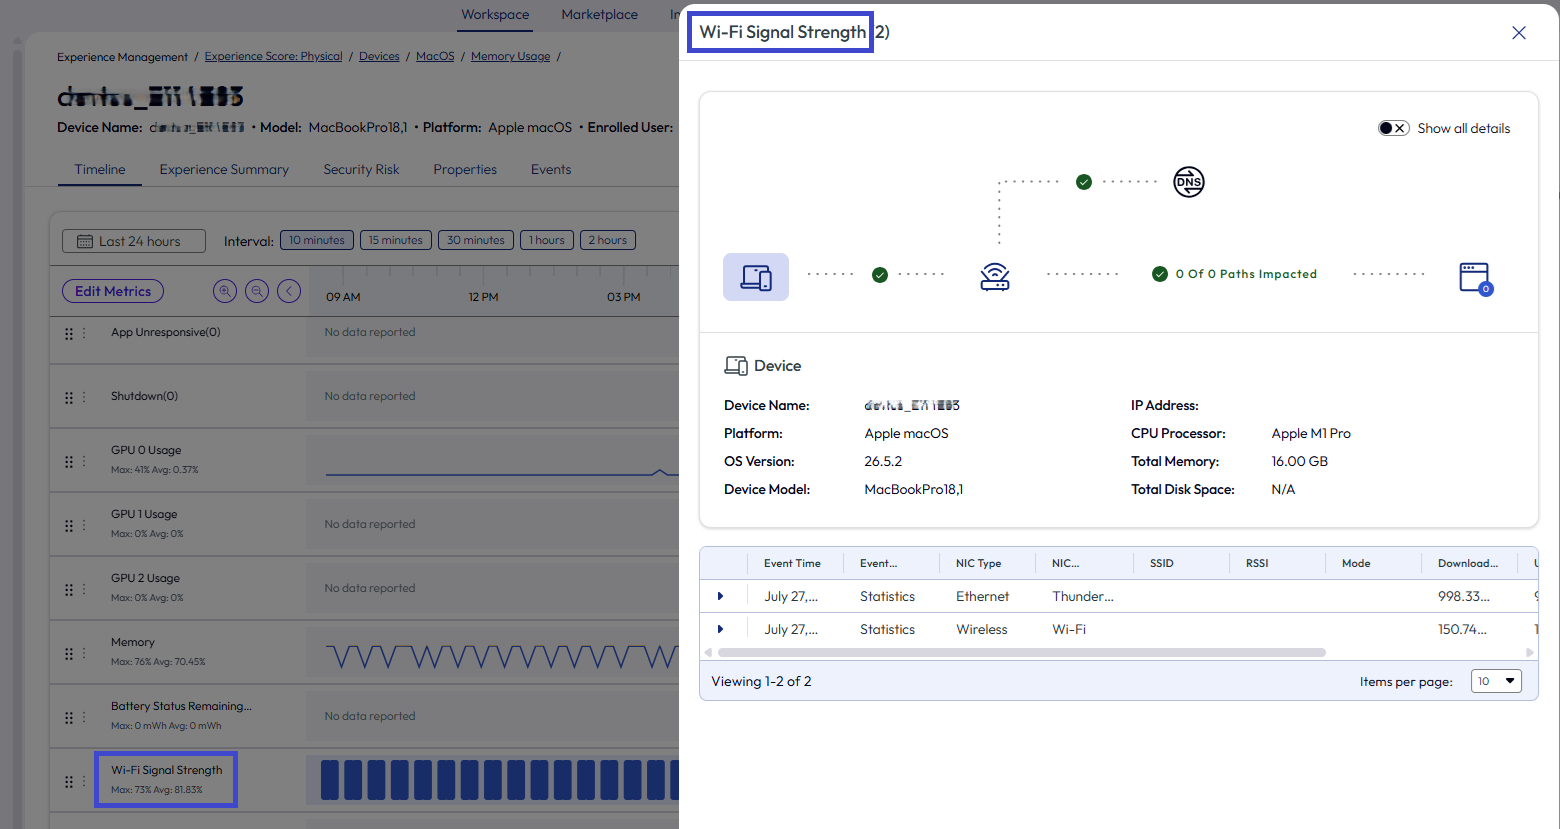
- You can select any marker, no matter the color, to open the map view.
For more details, see the Omnissa Community post Network Connectivity Map is Now GA on Physical Devices — See Every Hop Behind a Connectivity Complaint.
Hovering
Hover over a data point for details like the date and the number of events.
Breadcrumb trail and automated correlations
Select a data point in a timeline and view the tray on the right side of the UI to see the breadcrumb trail (event metadata). Breadcrumb trails display correlations between events and possible causes.
App Crash and CPU
Let's look at an example of viewing the breadcrumb trail for an app crash in a device timeline. Let's also check the CPU usage for events that might have caused the app crash.
- In a device timeline, on the Timeline tab, select the Overview view.
- Select a data point in the App Crash row. A tray displays on the right side of the UI.
- Select an app in the App Crashes list view to open the breadcrumb trail.
- Review the breadcrumbs for the app.
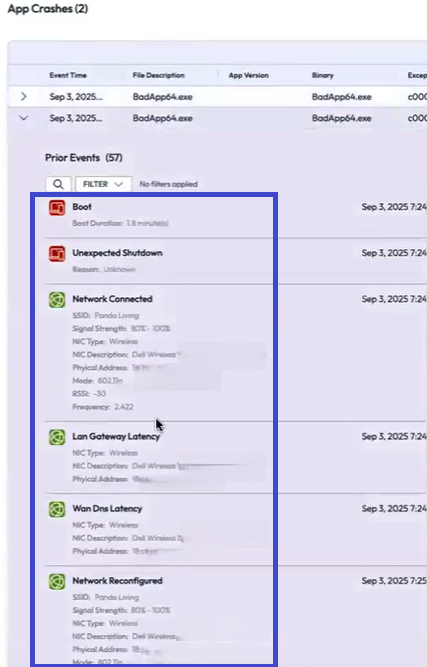
- The app BadApp64 experienced a Boot.
- The app then experienced an Unexpected Shutdown right after the Boot.
- Use the breadcrumb trail to follow the trajectory of the app crash and see if the app reconnected for the user.
- Close the App Crash tray and select a data point in the CPU Usage event row to see what might have used a lot of CPU at the time of the app crash.
- In the CPU Usage tray, ensure that the Max CPU column has the arrow pointing down.
- In the tray's app list view, the system displays objects that it correlated with the device timeline to offer possible causes for high CPU use.
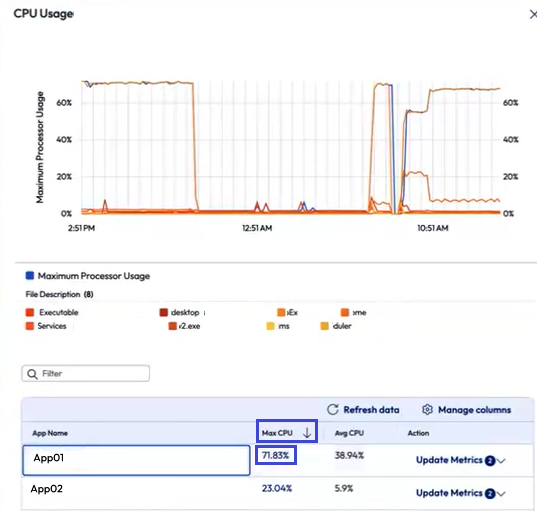
- In the screenshot example, the top app was using close to 72% CPU on the device.
- With multiple apps running, the loss of processing power can cause an app crash.
Use Investigations, Quickflows, or Playbooks to remediate the issue. Perhaps the user needs to update the app or they might need to update their device. Consider the device components. Perhaps the device needs more memory to run apps or it might need an updated processor.
Memory and CPU/GPU 0
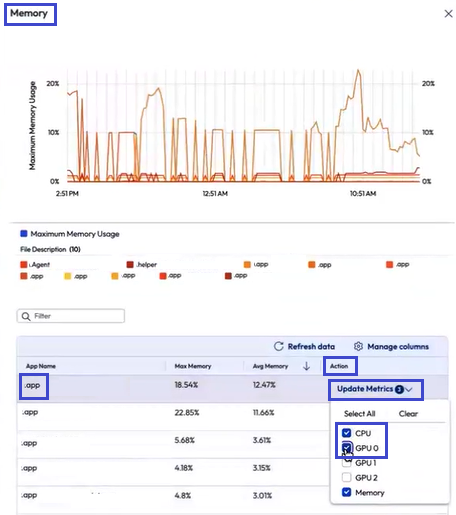
Let's look at an example of troubleshooting a memory issue with the breadcrumb trail and adding automated correlation events of CPU and GPU 0 Usage to the timeline.
- In a device timeline, on the Timeline tab, select the Overview view.
- In the Memory event row, select a high point in the line graph.
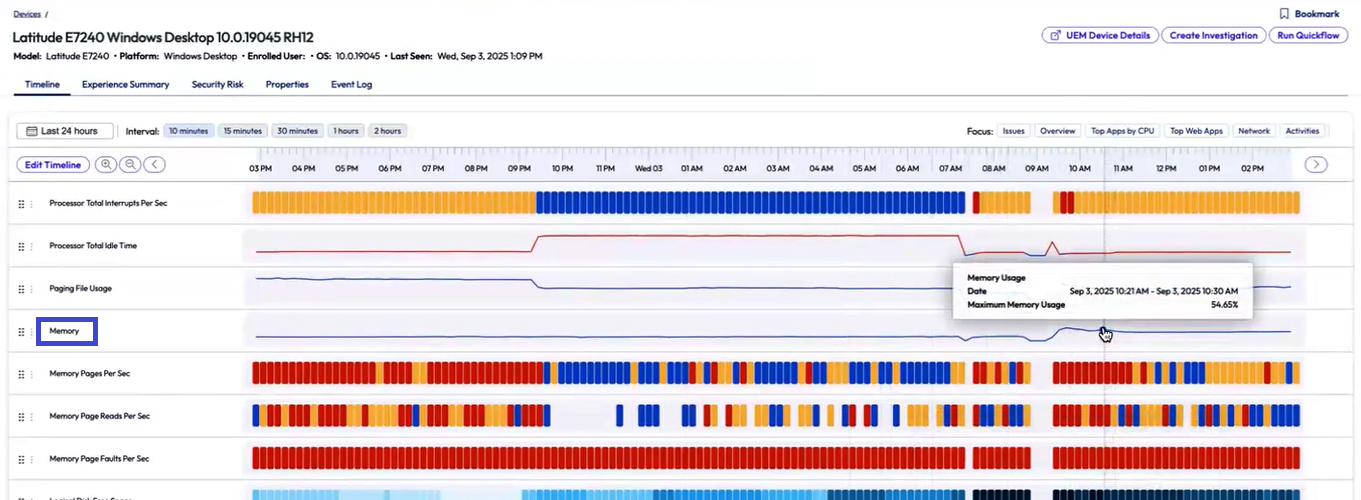
- In the Memory right side tray, filter the table by the Avg Memory column. The arrow points down.
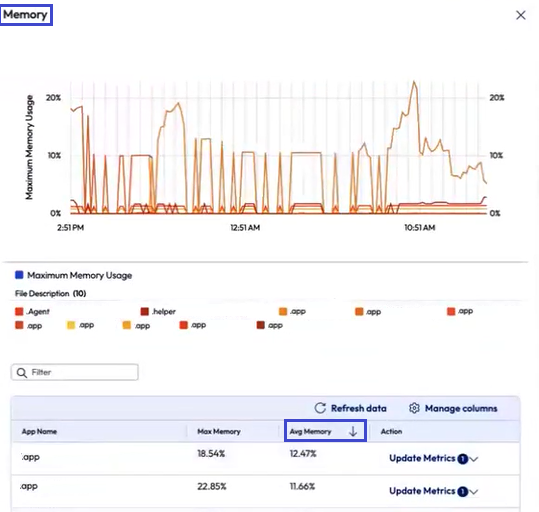
- The breadcrumb trail table displays a list of apps that are using a lot of memory.
- Customize the view by adding the app at the top table to your view.
- In the top app, select the drop-down menu option in the Action column..
- Select the CPU Usage and GPU 0 Usage metrics to add them to the view along with the app.
Use Investigations, Quickflows, or Playbooks to remediate the issue. Perhaps this device needs performance improvements so that the user can work and use apps that demand memory. Considering the age of this device, does the device need a refresh or replacing? Perhaps the user needs help accessing a reliable network?
Create a saved view
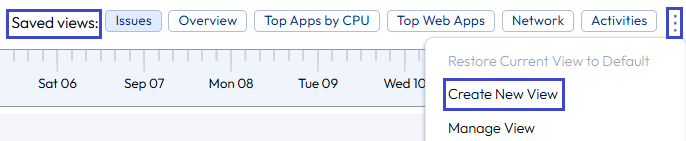
Use the Saved views options to customize the timeline to your research and troubleshooting workflow. If you are not sure how to start, use the Issues or Overview views as spring boards for research. If you know how you want events displayed, create your own layout for use in the Saved views area.
- Select the three vertical dots to create a layout view.
- Select Create New View.
- Enter a name for the view. For example you can enter My Layout.
- Select what layout view to start with.
- Duplicate of the current view: This option uses the layout you are currently in.
- Blank view: This option uses a blank layout.
- Select Create.
- Select My Layout and then select Edit Metrics to add any Device, Apps, or Web Apps data to your layout.
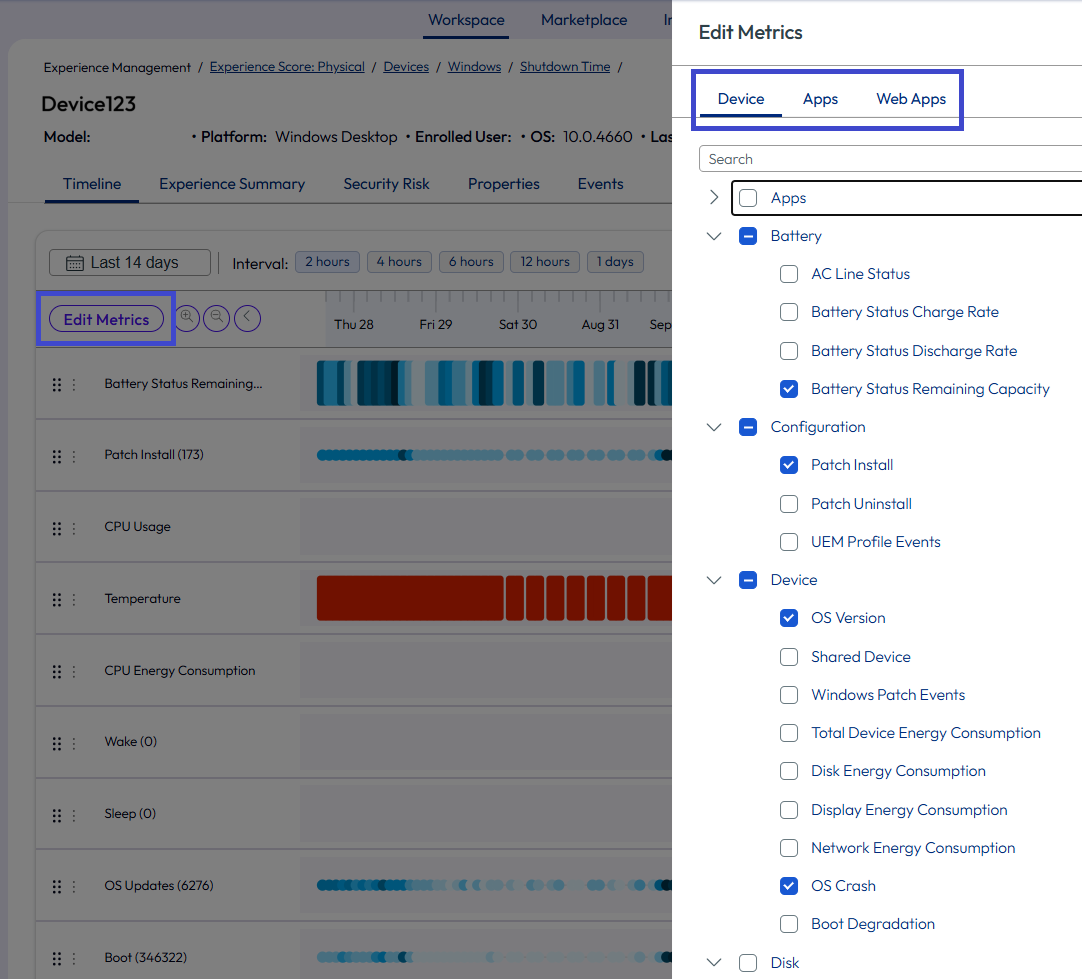
- You can drag and drop event rows and order them to fit your research. If you do change the order of event rows, you must save your changes to your view.
- Select the three vertical dots.
- Select Manage View to save your arrangement.
Remediation options
Remediate issues in device timelines using Investigations, Quickflows, and Playbooks. Access Investigations and Quickflows right in the device timeline UI.
- Investigations: Use Investigations and Guided Root Cause Analysis to remediate issues like run scripts, push apps, or push profiles to devices.
- Quickflows: Use Quickflows to remediate issues without the need for filter rules.
- Playbooks: Create Playbooks to troubleshoot with Investigations so your colleagues can use them to resolve recurring issues at the single device, multiple device, and app level.
More documentation
See the referenced content for information on the related features.
- Thresholds: Access Thresholds for details on how to change default threshold values.
- Risk Scoring: Access Risk Scoring for information on the risk analytics feature that is used on the Security Risk tab in device timelines.
Was this page helpful?