Use the Software Metering solution for Omnissa Workspace ONE Experience Management to monitor desktops, measure usage, and to act with automated actions for productivity and security applications. Software Metering in Omnissa Intelligence provides you visibility to application events across your managed resources.
Limited availability
Intelligence offers the Software Metering solution with limited availability. These features are available to a limited number of customers for extended feedback.
During limited availability, you can request access to the Software Metering solution from your Customer Connect representative. This request initiates the mapping process for Employee Experience and UEM applications within the your account. Software Metering starts collecting usage data after the mapping process is complete and the solution is enabled in the your environment.
The current release aggregates Employee Experience (also known as Experience Management) and Omnissa Workspace ONE UEM apps, but there are plans to extend this solution to new data sets.
Use cases
IT professionals can use Software Metering in the following scenarios.
- Portfolio visibility: A single view of all your software products to understand your application trends.
- Discover new software: Identify shadow IT to prevent application sprawl across your business.
- Optimize: Right size your application installations to reduce expenses and maintain compliance with your contracts.
- Compare: Compare usage across similar applications and lead an intelligent consolidation strategy.
Data definitions
For definitions of the data displaying in the Software Metering solution, go to the Experience Management for macOS and Windows Agent topic and see the Software Metering table.
Software Application Catalog
The Software Metering solution aggregates multiple data sources in to a single application name using a proprietary Software Application Catalog. This unique aggregation in to a single global app identifier within the Software Application Catalog maps the top productivity and security applications across all your desktops. This approach correlates usage across all platforms and application versions to create comprehensive user adoption metrics. Use these metrics to make strategic licensing decisions.
Note: You do not need to install the Software Application Catalog because it is part of the Experience Management agent.
Requirements
To use Software Metering, ensure you meet the listed requirements.
- Have the Employee Experience SKU. This SKU includes the measurement of application adoption across all desktop platforms supported by Workspace ONE.
- Use the Experience Management agent on managed devices. The solution uses the agent to record app activity data on managed devices.
- Experience Management for Windows
- Experience Management for macOS
- Software Metering supports Hub Registered mode.
- The Intelligent Hub agents must be properly deployed on devices.
- Management statuses for devices using applications in registered mode display as
Unmanaged. - For details about the four management modes for Workspace ONE UEM-managed devices, see the Omnissa Tech Zone article Workspace ONE UEM Management Modes.
Software Metering components
Use Software Metering components to view your app portfolio, find new software, optimize app use, and compare and consolidate apps.
Portfolio
The portfolio tab offers visibility in to all of the productivity and security applications that are mapped to the Software Application Catalog. This mapping helps you to see all of the applications within your environment and to create a strategic plan for your apps.
- Filters: The data displayed on the page is based on the filters selected.
- Total Active apps shows all applications that are mapped within the Software Application Catalog.
- Active Apps shows all applications that have an event based on the foreground activity selected. An event identifies an activity within the app like launching or stopping the app.
- Inactive Applications shows all applications that do not have an event based on the foreground activity set.
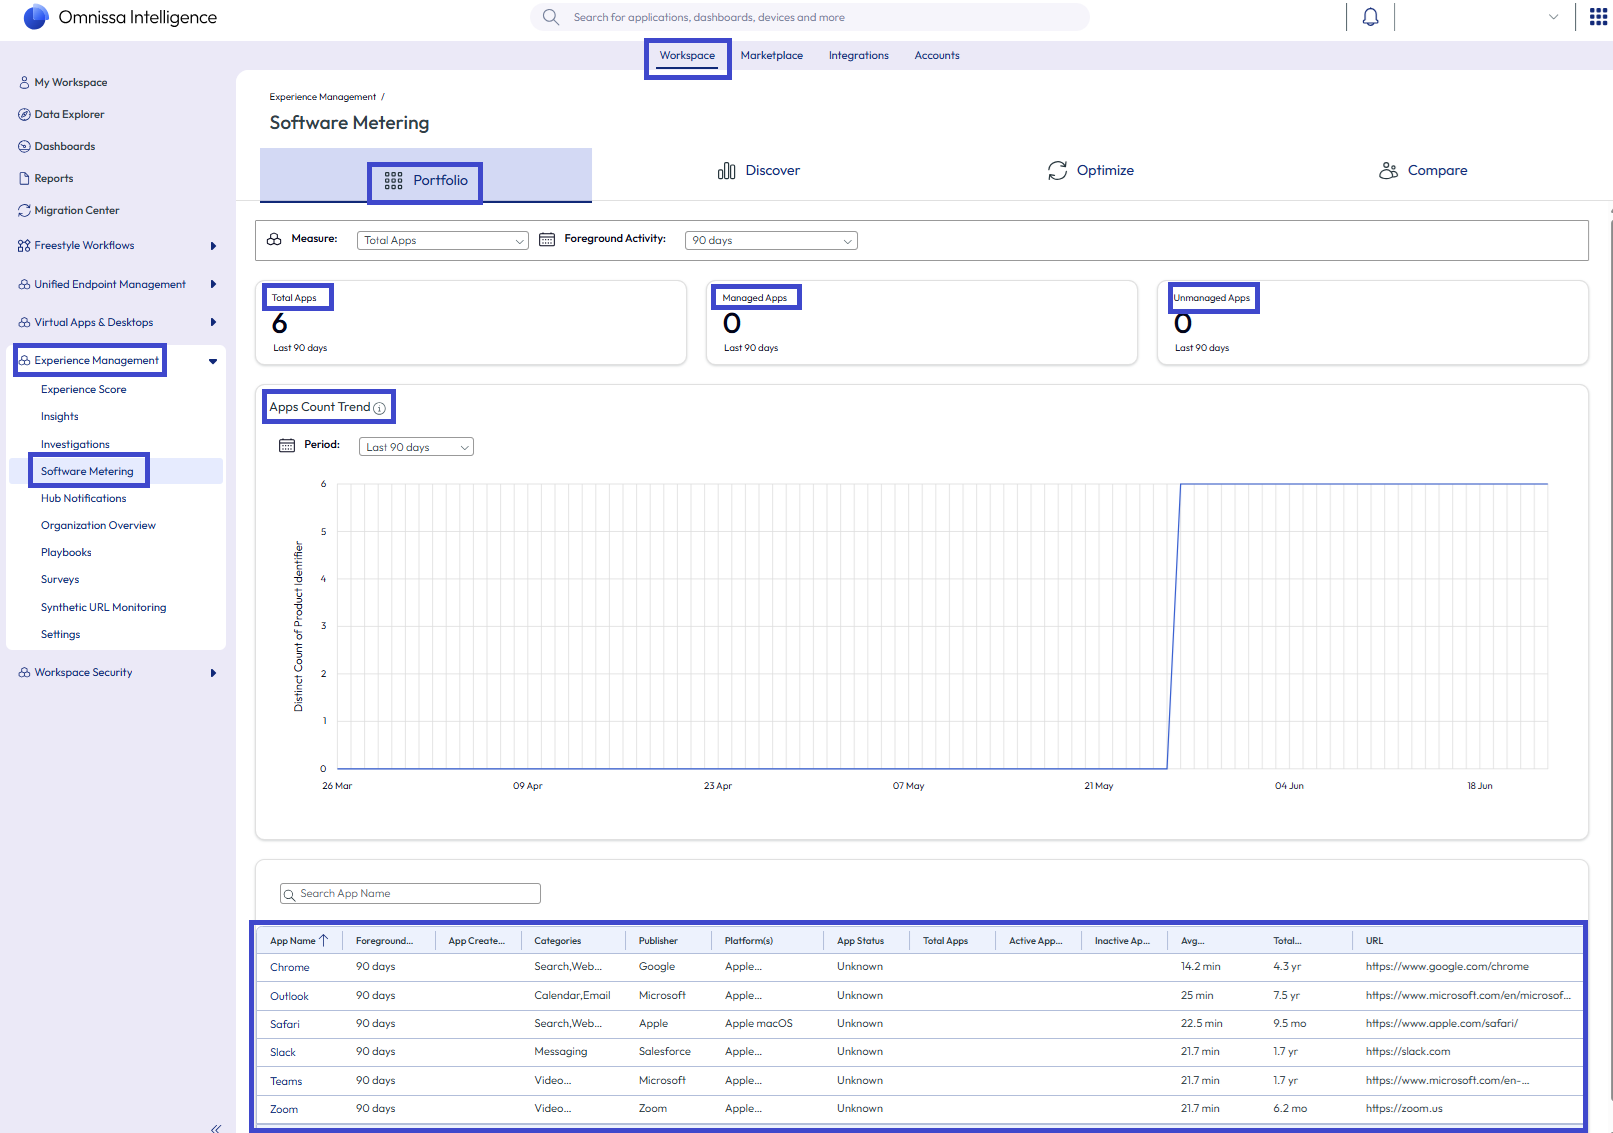
- Metrics: The Total Apps, Managed Apps, and Unmanaged Apps aggregates the count of software applications based on the UEM status.
- Consider that applications can have multiple statuses because the system is aggregating multiple apps from UEM and from Employee Experience.
- If there are two statuses for an application, having two statuses can indicate that a user has installed an unmanaged version of an IT approved application.
- Apps Count Trend: This trend chart represents a daily rolling count of software applications based on foreground activity selected.
- Each day on the x axis is a count of software applications with (or without) events based on the foreground activity.
- This chart can be adjusted up to 120 days to control the duration of the x axis within the chart. Manipulating the x axis helps you to view app count trends over a period of time.
- As an example, if the you select the Measure of Total Inactive Apps and a Foreground Activity of 30 days, then each day represents a rolling count of software products that have no usage events in the last 30 days.
- Apps Table: The table updates based on the filter criteria selected.
Discover
The Discover tab allows your IT administrators to see new software applications that are deployed across your environment. They can check if these apps that are installed on devices are unapproved, unmanaged, or unsanctioned. After identifying these applications, they can connect with the end users to determine if there is an approved app resource that is a fit for the user's needs. If not, perhaps IT would like to adopt this app or, if deemed risky, IT can remove the applications from devices.
-
Bar Chart: New applications are grouped by month based on the date the app was created. This date identifies the day that the app was first launched within your environment. You can select a time range that extends out to 120 days.
-
Apps Table: This table updates based on the filter criteria selected.
Optimize
The Optimize tab allows you to identify the most (Top 10) and least (Bottom 10) used applications based on the selected Measure and Foreground Activity.
- Measure: Select a filter depending on what you want to analyze.
- Total Apps provides the top 10 and bottom 10 installed apps based on the device count.
- Total Active Apps filters your top 10 and bottom 10 active apps with an event within the selected Foreground Activity.
- Total Inactive Apps filters your top 10 and bottom 10 inactive apps with an event within the selected Foreground Activity.
- Apps Table: The table updates based on the filter criteria selected.
Compare
The Compare tab reviews the use of applications so you can make informed, strategic decisions about consolidating applications within your software stack. This tab can also help you justify moving from a free product to a paid solution.
Apps Table: The table updates based on the filter criteria selected.
Application profile
When you select an app in an Apps Table, you see its application profile. The application profile page provides a detailed view of all the mapped applications to the unified global app identifier as reported in the Software Application Catalog. This view aggregates the adoption of the app across all devices.
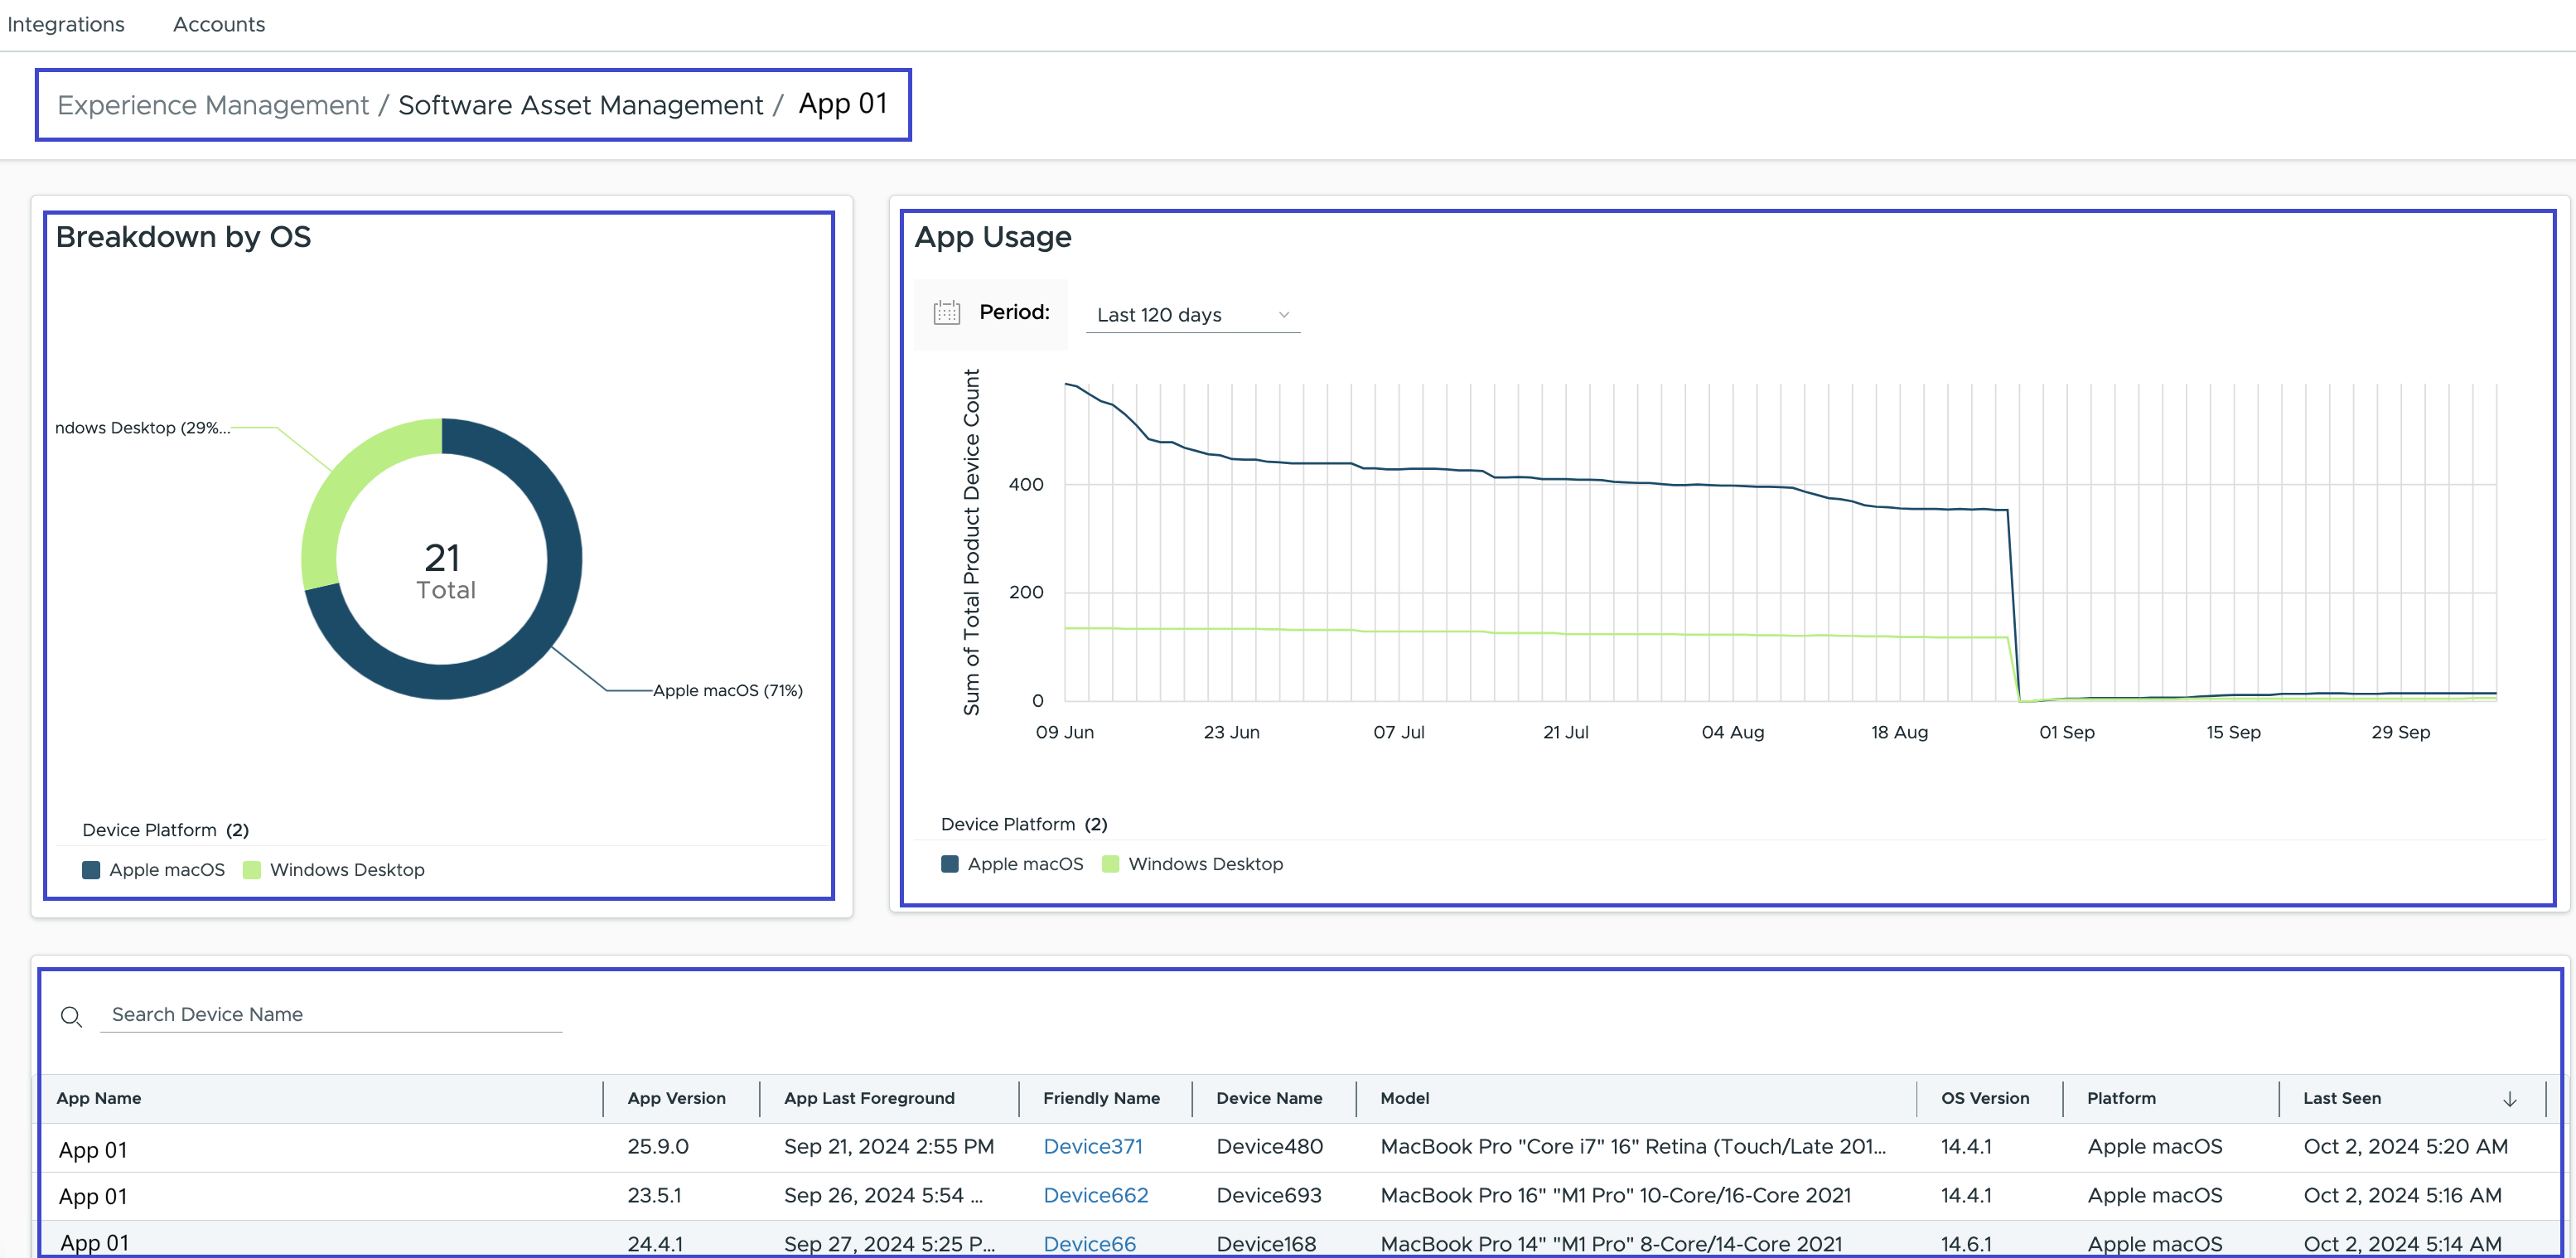
- Donut Chart
- Breakdown by OS: The Windows and macOS device counts are the sum of managed and unmanaged applications installed on all devices. A device can have duplicates since the same application can have both a managed and an unmanaged status.
- Total Windows = Windows Managed + Windows Unmanaged
- Total macOS = macOS Managed + macOS Unmanaged
- Total Count: The total count inside the donut chart is an aggregate of Windows and macOS application counts. Since both platforms include managed and unmanaged applications the same device can have a duplicate count in the total.
- Value inside the donut = Windows Managed + Windows Unmanaged + macOS Managed + macOS Unmanaged
- The data for the Donut Chart is derived from the
product catalog metricsreport table.
- Breakdown by OS: The Windows and macOS device counts are the sum of managed and unmanaged applications installed on all devices. A device can have duplicates since the same application can have both a managed and an unmanaged status.
- Trend Chart
- App Usage: The trend chart tracks the daily snapshot of the donut chart.
- To view history of the donut chart, hover on the desired date and time to view the application usage.
- The current date matches the Windows, macOS, and total counts in the donut chart.
- The data for the Trend Chart is derived from the
product catalog metricsreport table.
- Device List Table
- The table is a list of devices with applications that meet the filter requirements.
- Since a device can have multiple versions of an application installed, there can be multiple rows for the same device.
- The source for the data within the device list table is the
app activityreporttable.
Measure and Foreground Activity filters
Use the Measure and Foreground Activity filters to select the metrics reflected in trend graphs and tables.
| Filter | Description |
|---|---|
| Total Apps | Software applications that are active or inactive on a device within the Foreground Activity. The app must be installed on devices. Total Apps = Active + Inactive |
| Total Active Apps | Software applications on a device that have used the app within the foreground time period selected. Active Apps = Total Device Count with apps installed - Inactive Device Count |
| Total Inactive Apps | Software applications on a devices that have not used the app within the selected Foreground Activity time period. Inactive Apps = Total devices with app installed - Active Device Count |
| Foreground Activity | Sets the duration for analyzing application events. The Foreground Activity allows you to set the following thresholds for app events: 14, 30, 45, 60, 90, and 120 days. |
Report templates
Use report templates from the Marketplace to view and interact with your Software Metering data.
- Product Specific templates: See usage for multiple applications within a suite (like in Adobe or Microsoft). Use these templates to help view the overall strategy for managing apps within a suite of tools.
- Inactive App templates: See all apps with no activity within a time period across your app environment.
- Mapped and Unmapped templates: View Software Application Catalog apps that are mapped or not mapped to the Software Metering solution.
To find report templates, go to the Marketplace in Intelligence.
- In Intelligence, go to Marketplace > Templates > Reports.
- In the search text field, enter
Software Meteringand select the desired template. - You can Preview the template before you add it to your workspace.
- Select Add to Workspace and complete the required template entries (like naming the report).
- Save the report to your workspace.
- To access the report, go to Workspace > Reports, select the Overview tab, and select the report from the reports list view.
Was this page helpful?