Omnissa Horizon Cloud integration ingests and displays Horizon analytics in a centralized location in Omnissa Intelligence. Use Intelligence dashboards and reports to view and analyze the health of your Horizon deployment.
Entitlements
Visit the Omnissa™ products pages for the latest information on products and solutions.
Monitoring
Horizon Cloud monitoring in Intelligence is entitled to all Horizon Universal subscription customers, including Horizon Apps Universal subscriptions and Horizon Apps Standard subscriptions.
Workflows
Using workflows with Horizon Cloud data in Intelligence is entitled to Horizon Universal subscription customers with the Experience Management for Horizon add-on.
Requirements
- To monitor Horizon Cloud Sessions and VM related metrics in Intelligence, activate Agent Data Monitoring within your Horizon virtual machines. See Configuring Horizon Edge Agent Data Monitoring for Horizon Edge with Workspace ONE for details on how to activate Agent Data Monitoring.
- Authenticated proxies are not supported for this integration. Using an authenticated proxy will prevent the sending of data to Intelligence, causing your dashboards and reports to not populate data correctly.
Integration is done for you
Integration of Horizon Cloud with Intelligence is done for you. Intelligence is a default service provided to Horizon Cloud customers. The integration between Horizon Cloud and Intelligence happens automatically when you onboard to Horizon Cloud. No manual setup is needed.
Monitor data from the Horizon Universal Console Home page
You can also use monitoring services in the Horizon Cloud console that is powered by Intelligence. Refer to the article Monitoring the Status of Horizon Cloud Resources from the Home Page.
How do you deauthorize Horizon?
To deauthorize Horizon Cloud, work in the Integrations area of Intelligence.
Important: Do not deauthorize the integration unless you are certain you no longer want to share data between the two systems. To re-activate the Horizon Cloud and Intelligence integration, you must contact Operations.
- In Intelligence, go to Integrations > Data Sources.
- Find the Horizon Cloud card and select the ellipse (...).
- Select Deauthorize.
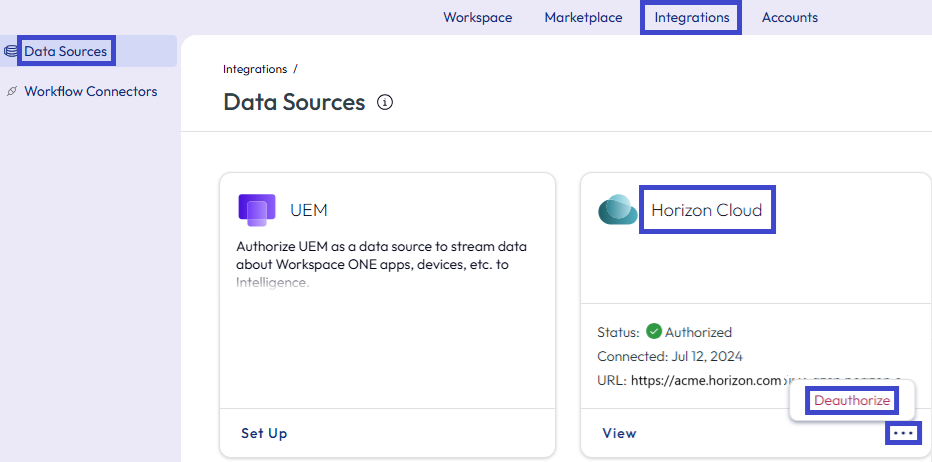
Results: After you deauthorize the integration, the Horizon Operations Overview dashboard appears empty and the dashboard no longer receives data for Sessions, Agents, or Edge errors.
Access data with the Horizon Operations Overview dashboard
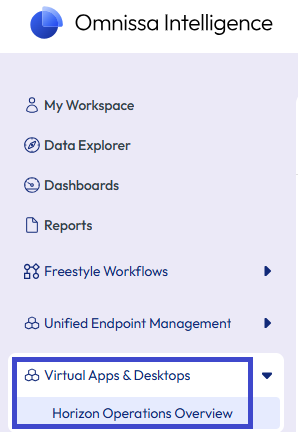
Use the Horizon Operations Overview for an extensive view of all your Horizon data in Intelligence found in the console at Workspace > Virtual Apps & Desktops > Horizon Operations Overview. Look for indicators of possible problems so you can act immediately to remediate. For example, look for expiring certificates, find UAG appliances using too much CPU, or find sessions with excessive login in times.
The overview offers a view of the health of your Horizon integration at a glance.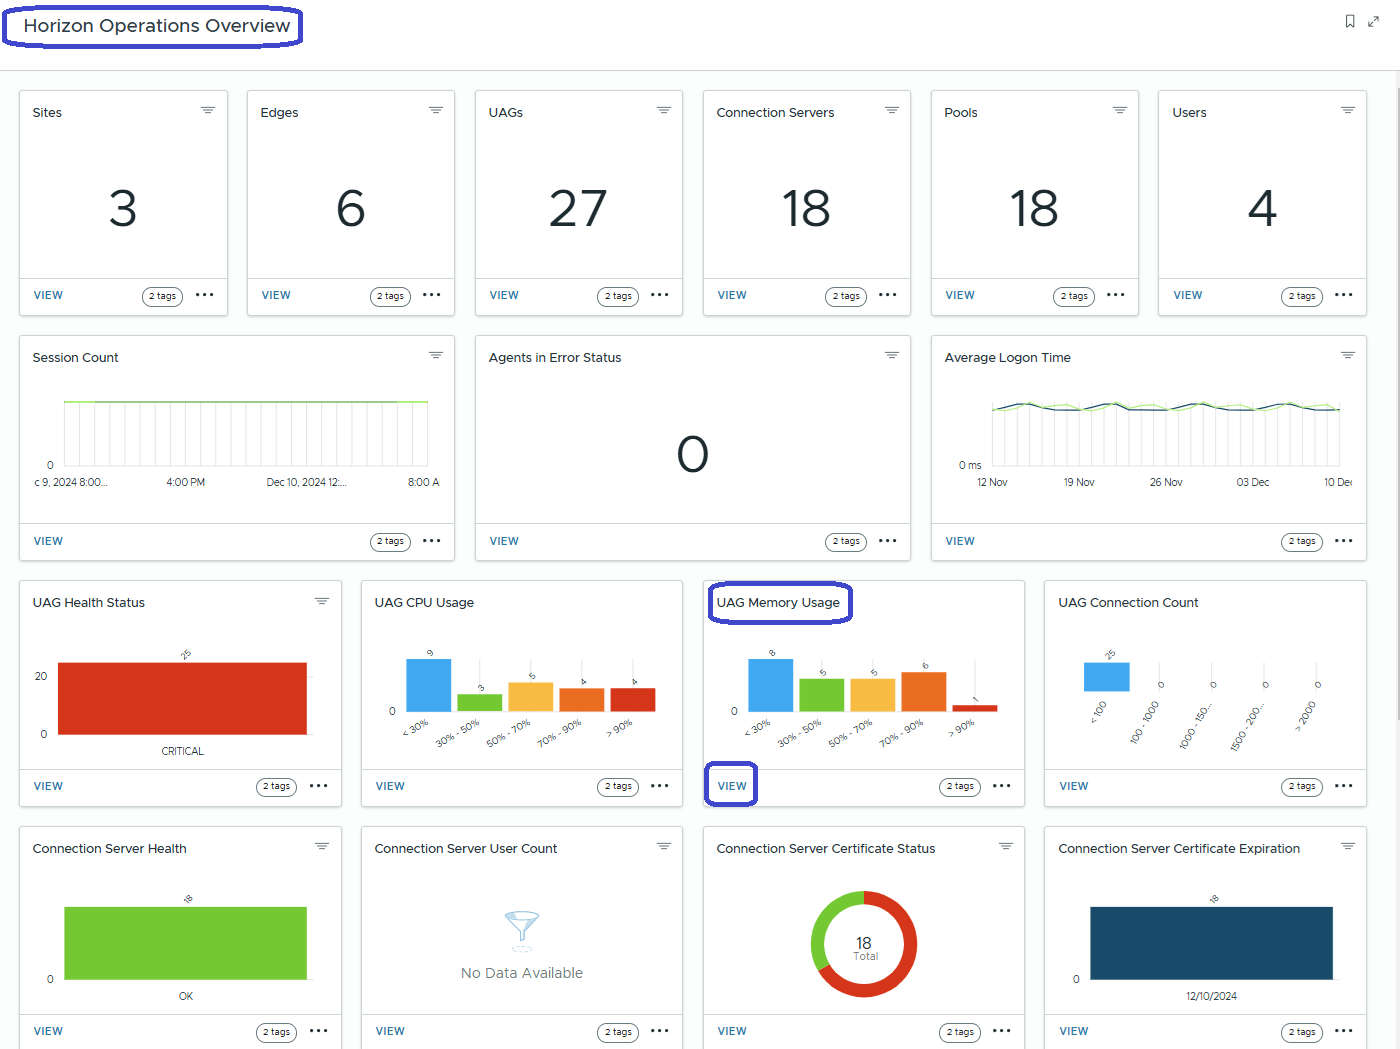
Use the tiles to navigate to specific data sets for your Horizon components. For example, select View on the UAG Memory Usage tile to navigate to the chart highlighting those UAG appliances using excessive memory.
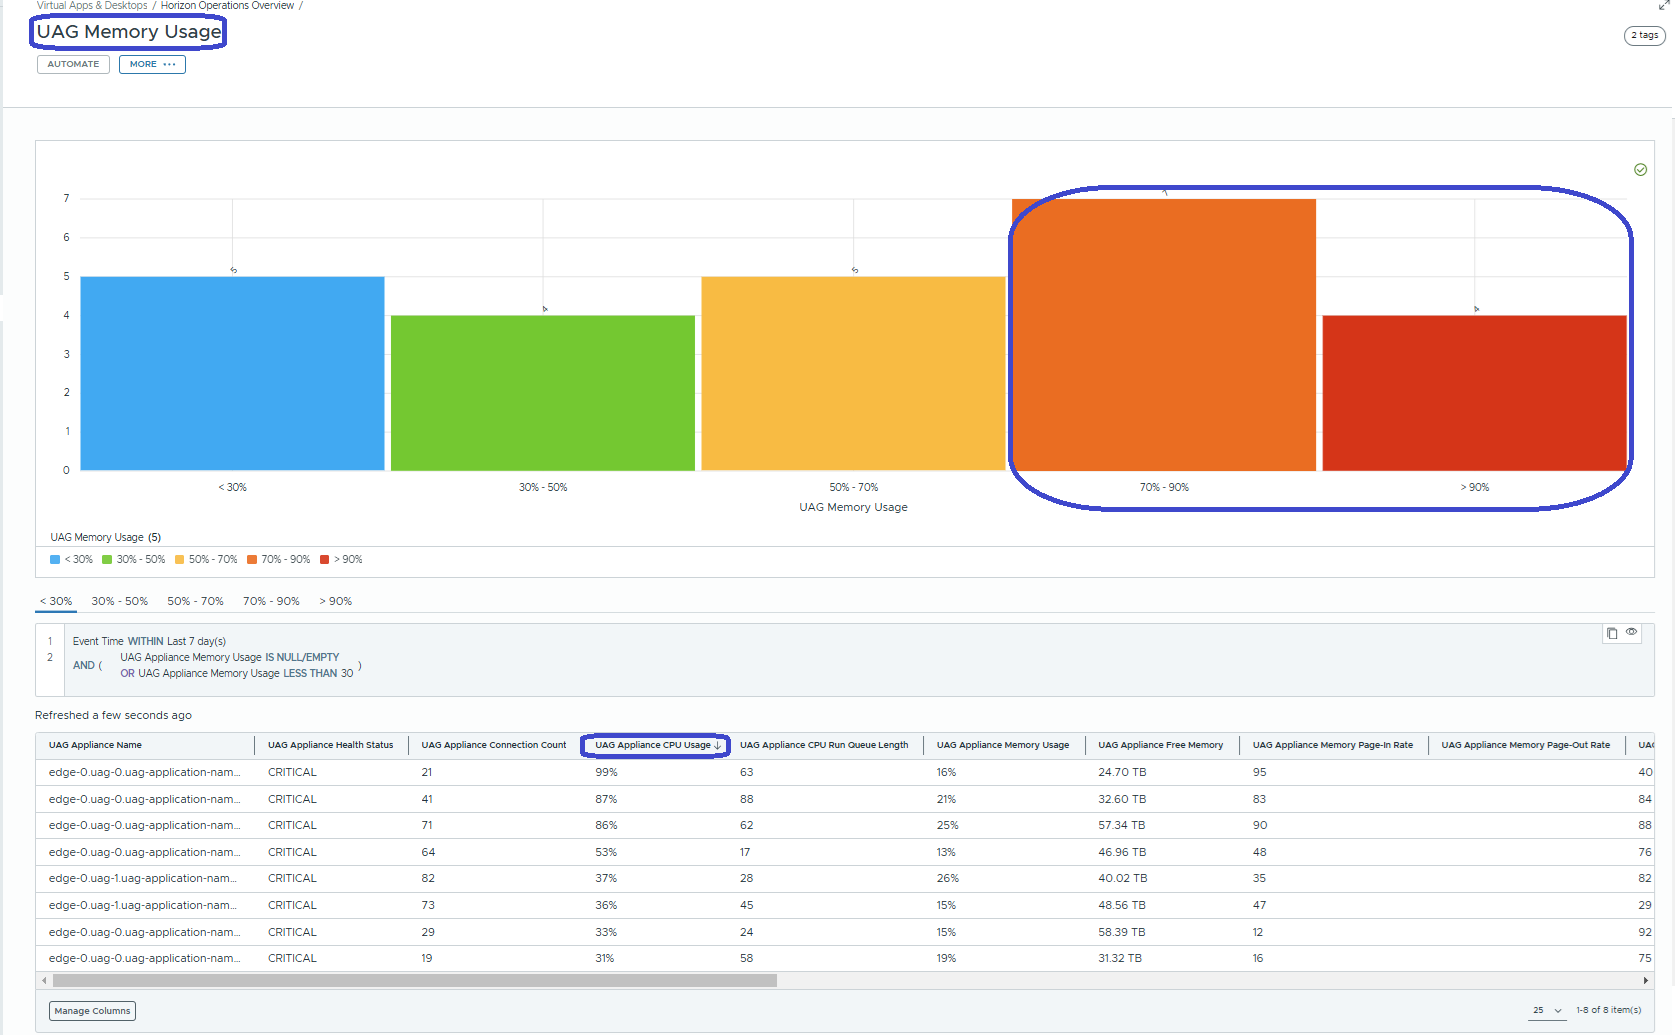
Navigating from the overview into a tile for UAG Memory Usage, brings you to data that you can sort and act on. For example, sort the UAG Appliance CPU Usage column in the UAG Memory Usage widget so that the appliances using the most CPU are at the top (arrow pointing down). You can see that these appliances have a health status of Critical.
You can also use the chart as a visual indicator to quickly find those appliances in the orange and red zones about to meet capacity. The data in the UAG Memory Usage widget helps identify those appliances that you can optimize and reduce their CPU usage.
How do you create a custom dashboard?
Horizon Cloud custom dashboards using allow you to create your own widgets using Horizon Cloud data. Share these dashboards with colleagues and other business teams.
- Create a custom dashboard, so that you can add custom widgets to it.
- In Intelligence, go to Workspace > Dashboards.
- Select Add, and then select Custom Dashboard.
- Enter a name for the dashboard to help you quickly identify the dashboard.
- Optionally, you can enter a description for the dashboard. Consider the description as a tool to help remember why the custom dashboard was initially needed.
- Save the dashboard.
- Add a custom widget to your custom dashboard.
- If you are not in the custom dashboard, you can find it in the console at Workspace > My Workspace > Recent Dashboards. You can also find dashboards in the console at Workspace > Dashboards.
- Select Add Widget > Custom Widget.
- For the Category, select Horizon, and then select the data point you want to showcase in your widget.
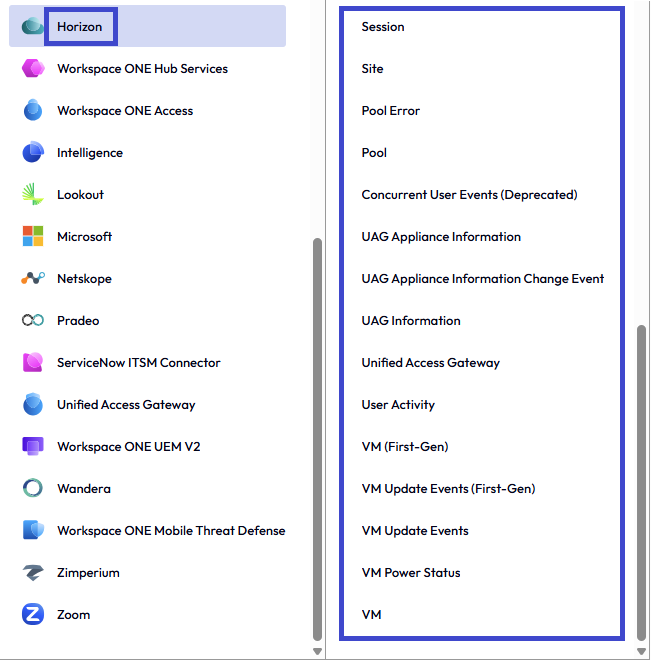
- Enter a name and a description for the widget.
- Configure the Data Visualization area. Use the Summary to preview your custom widget to see if your configurations are capturing the data you want, and change configurations as necessary.
- Complete the Snapshot data, which represents data in your deployment now.
- Chart Type: Select how you want the widget to display your data.
- Measure: Sets how the widget counts the data by an aggregator (of [aggregator]) you select.
- Count: Sets the number of rows in a particular data set. The count is the simplest function for verifying results.
- Distinct Count: Returns a count of unique or distinct values identified over the data range set.
- Max: Returns the largest values in a particular data set. This setting only works with numerical columns.
- Min: Returns the smallest values in a particular data set. This setting only works with numerical columns.
- Average: Calculates the average of a selected group of values. This setting only works with numerical columns.
- Group by: Separates data into groups. Widgets can display two groupings per data set.
- Results per group: Reduces the results displayed. For example, use a value of 10 to show data for a top 10 list of the most installed applications.
- Configure the Filter to define the baseline data sets for your widget. Use Add Rule and other parameters to define the data you want to see on your custom dashboard.
If the system has no information to display, it notifies you. However, you can change configurations to see if a different parameter, like Measure or Group by, might display data in your widget.
How do you create a custom report?
Horizon Cloud custom reports allow you to create unique reports using Horizon Cloud data that you can share with colleagues and other business teams.
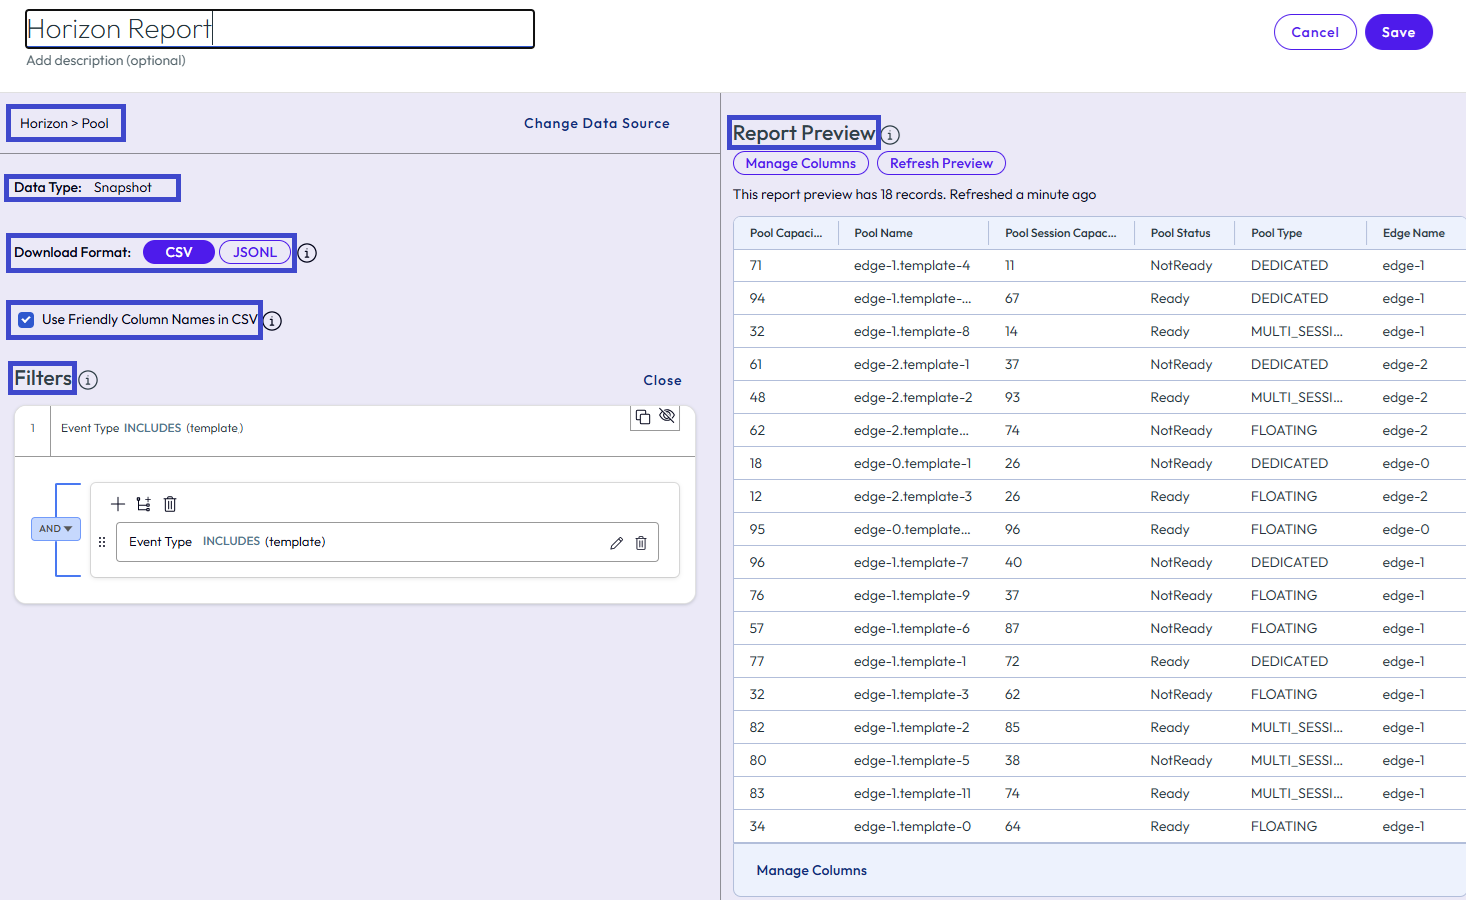
- In Intelligence, go to Workspace > Reports and select Add > Custom Report.
- For the Category, select Horizon, and then select the data point you want to showcase in your report.
- Enter a name for the report. Adding a description is optional.
- Select the Download Format, CSV or JSONL (JSON Lines).
Important: You cannot change the selected format after you create and run the report. This behavior helps to maintain the same format and output when you share the file with other users. - You can select to use the friendly column names in the CSV file you download.
- Configure the Filters using an attribute that corresponds to the data you are trying to gather.
- Select an operator and the filter rule value.
- View the Report Preview to see results of the reports query. You can edit the rules to change the data in the preview. Select Refresh Preview to see if your changes resulted in updated data.
- Save the report.
Using workflows (Freestyle)
You can trigger workflows choosing Horizon data as the data source. Here are some sample use cases for creating workflows that monitor your Horizon Cloud environment.
Case 1: Monitor Horizon Cloud Edge Gateway connectivity
When there is a connectivity issue with Edge, Horizon Cloud control plane loses visibility into resource monitoring your desktops, farms, and VMs with Horizon agents. This loss of visibility makes it critical to ensure Edge Gateway connectivity for Horizon deployments.
Create a workflow that ensures the system notifies a selected admin after a connectivity issue with Edge.
- In Intelligence, go to Workspace > Freestyle, select General, and then select Add Workflow.
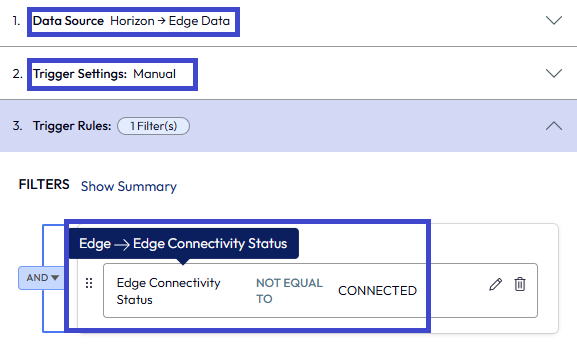
- Select Horizon as the Data Source, and then select Edge.
- Select Manual as the Trigger Settings.
- Complete the Trigger Rules.
- Select the attribute Edge > Edge Connectivity Status.
- Select Not Equal To as the operator.
- Select Connected as the status value.
- Select Refresh in the Potential Impact menu option to view a preview of possible results for the workflow.
- Drag and drop the Action button below the Workflow Settings.
- Select Intelligence > Send Email, and then select Add Action.
- Enter the email information for the admin you want to receive notifications about loss of Edge connectivity.
- Save the workflow.
- Select Enable Workflow to start using the workflow on incoming data or you can wait to activate the workflow later. The system does not start looking for triggers on a manual schedule until you activate the workflow.
Case 2: Monitor UAG health status
The UAG (Unified Access Gateway) activates a secure, remote access from an external network to internal resources such as virtual desktops and published applications. You can use workflows to proactively monitor UAG health.
For example, If the UAG is in an unhealthy status, the Control Plane notifies Intelligence that the UAG Health Status is CRITICAL. Create a workflow to alert admins about the status by email, Slack, or ServiceNow ticket.
- In Intelligence, go to Workspace > Freestyle, select General, and then select Add Workflow.
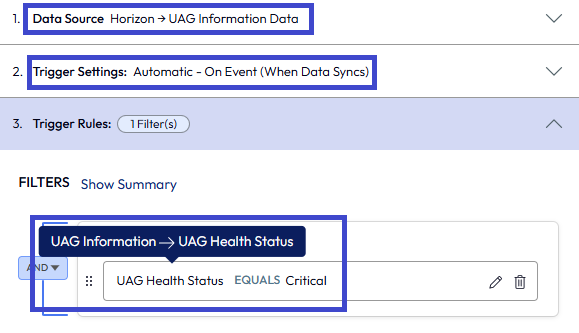
- Select Horizon as the Data Source, and then select UAG Information.
- Select Automatic as the Trigger Settings.
- Complete the Trigger Rules.
- Select the attribute UAG Information > UAG Health Status.
- Select Equals as the operator.
- Select Critical as the status value.
- Select Refresh in the Potential Impact menu option to view a preview of possible results for the workflow.
- Drag and drop the Action button below the Workflow Settings.
- Select Intelligence > Send Email, and then select Add Action. Other options include to use Slack Web API or ServiceNow actions if you have integrated these services with Intelligence.
- Enter the email information for the admin you want to receive notifications about UAG status.
- Save the workflow.
- Select Enable Workflow to start using the workflow on incoming data or you can wait to activate the workflow later. The system executes the workflow when incoming events match the trigger rule.
Was this page helpful?