You can use Omnissa Workspace ONE Experience Management data in Omnissa Intelligence to get a Marketplace dashboard template to view power consumption for your organization. You can also create your own custom dashboard to visualize power consumption per device.
Total power consumption data received from various categories
Intelligence receives power consumption data from many categories, and some categories include CPU, display, network, disk, and system on chip. Other categories that Intelligence receives power consumption data for are MBB (mobile broadband) and EMI (electromagnetic interference). When you view total power consumption data for a device, you are viewing power consumption received from all the available power consumption categories in Intelligence.
Limitations
The data the system collects from virtual machines has varying accuracy because of the available power consumption simulation modelling.
Event frequency from the Power Tracker
The Windows Power Tracker sends data for the event device_power_consumption to Intelligence every hour. This interval can deviate from the default frequency due to the operating system. Also, the frequency can shorten during the first cycle because of the Employee Experience service starting.
Requirements
- Use the Experience Management feature.
- Manage devices with Omnissa Workspace ONE UEM.
- Use Windows devices running Windows 11. This feature does not work on earlier versions of Microsoft Windows.
Marketplace dashboard template
Get the DEX Getting Started - Power Consumption dashboard template from the Marketplace to view various power consumption widgets for your Experience Management deployment.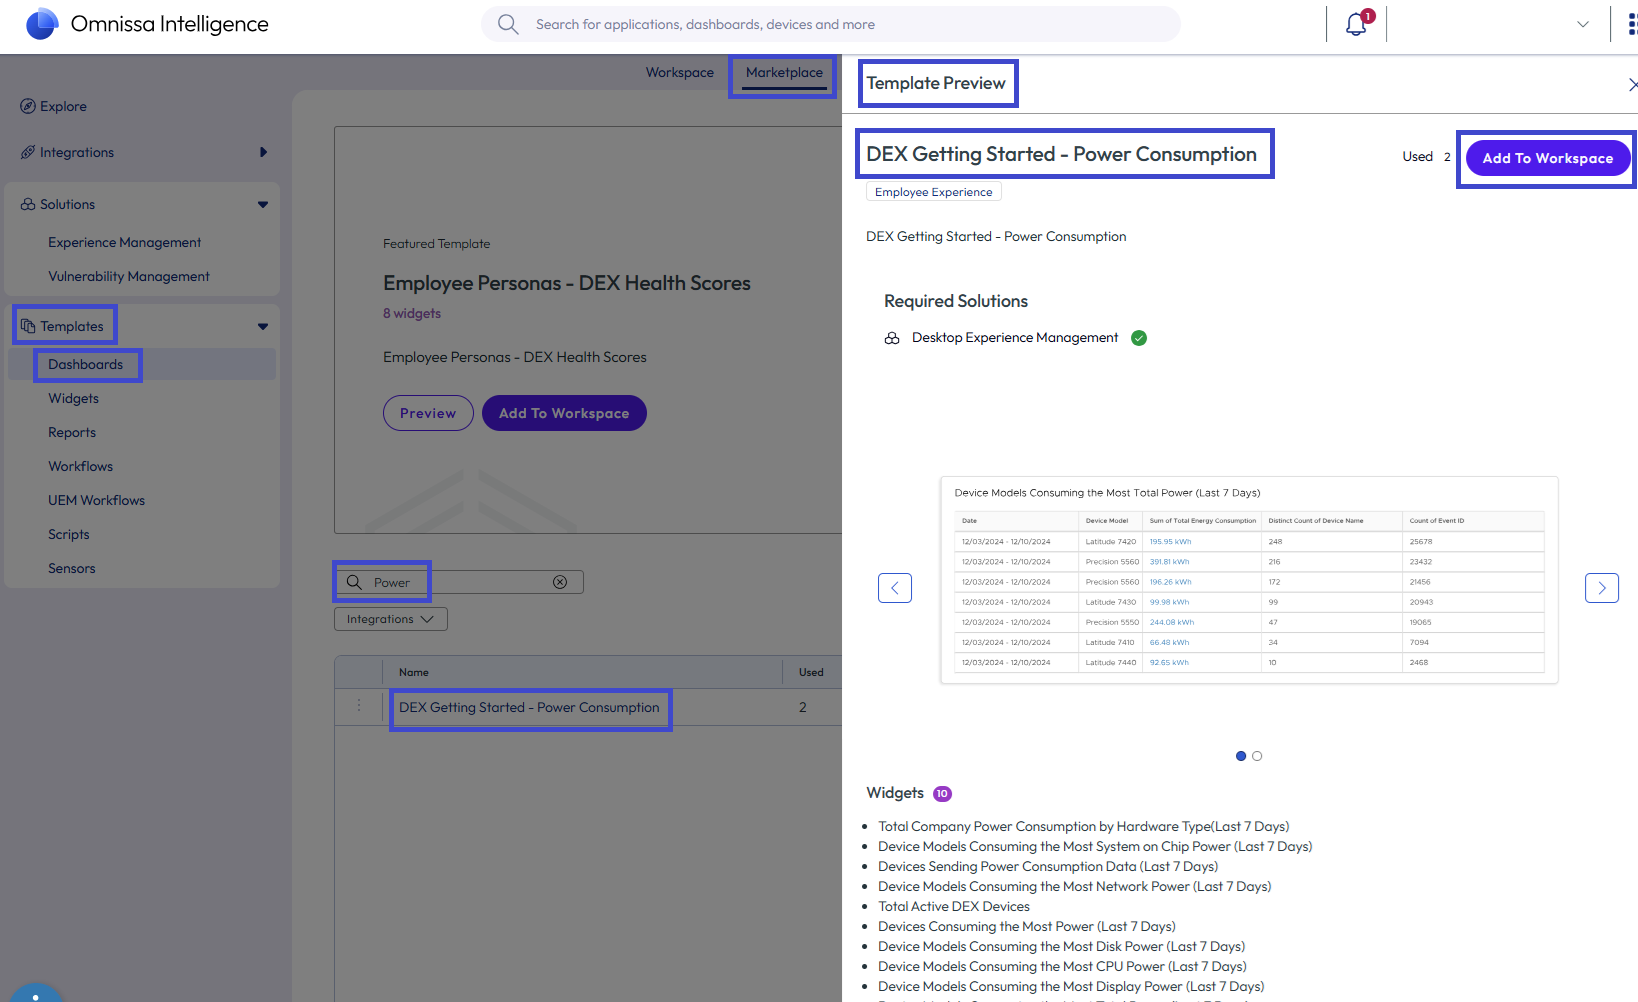
- In Intelligence, got to Marketplace > Templates > Dashboards.
- Type
Powerin the search field. - Select the DEX Getting Started - Power Consumption option and view the template preview.
- Add the template to your dashboard workspace.
- To access the dashboard, go to Workspace > My Workspace > Recent Dashboards and select View on the DEX Getting Started - Power Consumption tile.
Custom dashboard
If you do not want to use the dashboard template, you can create your own power consumption dashboard.
Procedure
Create a custom dashboard to view power consumption per device. You can select multiple devices for display in this custom widget.
- In Intelligence, go to Workspace > Dashboards and select Add > Custom Dashboard.
- Enter a name for the dashboard and save it.
- In your power consumption dashboard, select to Add Widget.
- Enter a name for the widget and then select the data source Employee Experience > Device Performance. If you don't add a name, the system does not activate the Save button.
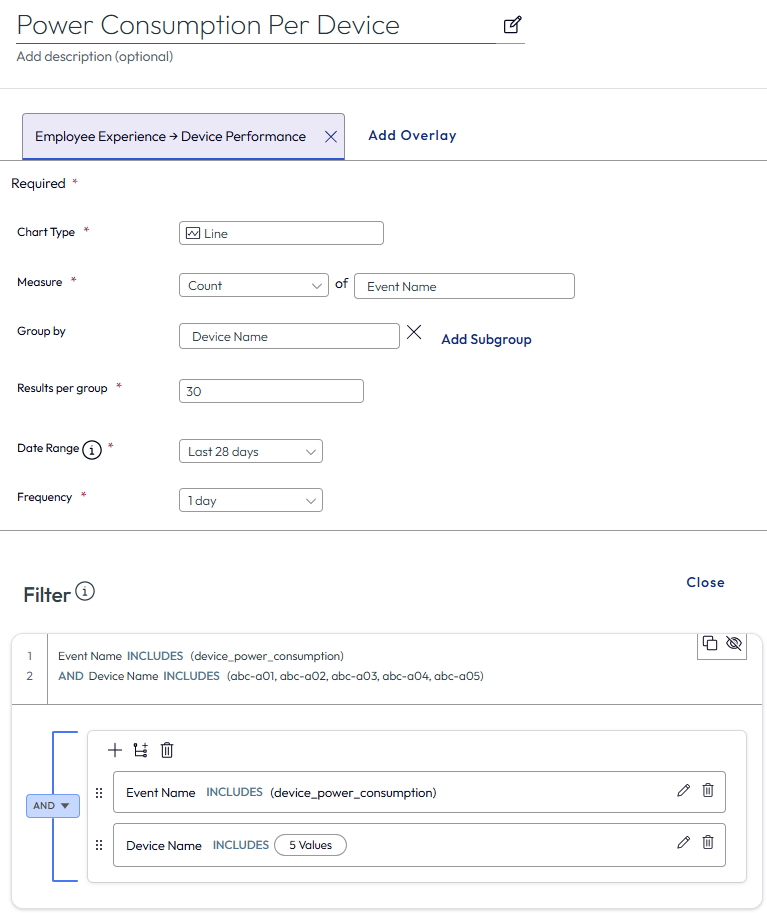
- Use these settings for the design elements.
- For the Chart Type menu item, select the type that makes the data readable.
- Consider Line or Vertical.
- Use the Preview panel to select a readable chart type.
- For the Measure menu item, select Count of Event Name.
- You can enter Device Name for Group by.
- To see many events per device, you can configure the Results per group as 30.
- To see events per device over a longer period of time, select Last 28 days for the Date Range.
- Use 1 day for the Frequency to collect many events as reported by the Power Tracker to display in the widget.
- For the Chart Type menu item, select the type that makes the data readable.
- In the Filter section, add the attribute Device Performance > Event Name that Includes the attribute
device_power_consumption.- If you do not have a Device Performance category, enter
Event Namein the text area to find it in the Other category.
- If you do not have a Device Performance category, enter
- Add another Filter, joined with And, by selecting the plus (+) icon.
- Add the attribute Device > Device Name that Includes the attribute
<Device Name>, and select all the devices you want information for in the available device drop-down list. - Use the Preview panel to view results and save the widget.
Was this page helpful?