View and interact with your Omnissa Workspace ONE data in dashboards displayed in Omnissa Intelligence. In Omnissa Workspace ONE UEM, you must have the Intelligence admin role to access and use dashboards.
Requirements to access Dashboards
To access the data in dashboards powered by Omnissa Intelligence, use the supported version of Workspace ONE UEM, enable Reporting, install the Omnissa Intelligence Connector Service (for on-premises deployments), and set admin roles.
- Use the required Workspace ONE UEM console version. Intelligence requires the minimum supported version of the Workspace ONE UEM console. For general availability, end of availability, and the end of support dates for all Workspace ONE UEM console releases, see the knowledge base article Workspace ONE (WS1) UEM Console Release and End of General Support Matrix.
- Configure the Intelligence admin role in Workspace ONE UEM. For new admin roles, include permissions for Intelligence so that admins can access settings.
- Use Reports powered by Omnissa Intelligence. Intelligence uses the data in the reports data warehouse to display analytics from your Workspace ONE deployment.
- If you have an on-premises deployment, install the Intelligence Connector for communication between the Reports infrastructure and dashboards.
- Before using Intelligence features, you must install the Intelligence Connector service onto a separate server in your Workspace ONE UEM environment.
- Each feature uses the Intelligence Connector Service installed from the Intelligence Connector Installer. The Intelligence Connector service gathers the data from your Workspace ONE UEM console server and pushes it to the reports cloud service.
Sharing dashboards
You can share dashboards with other Intelligence users. This action is available for any dashboard that you create. The owner of the dashboard is designated with full access, while the users who share the dashboard are designated with Can View (read only) or Can Edit access (read and write). Users with Can View access have limited actions available to them, such as:
- View
- Add to Bookmarks
- Duplicate
Users receive an email after you share a dashboard with them.
To share a dashboard use your Recent Dashboards area to quickly find a dashboard you've been working in. You can also perform this task from the Dashboards page.
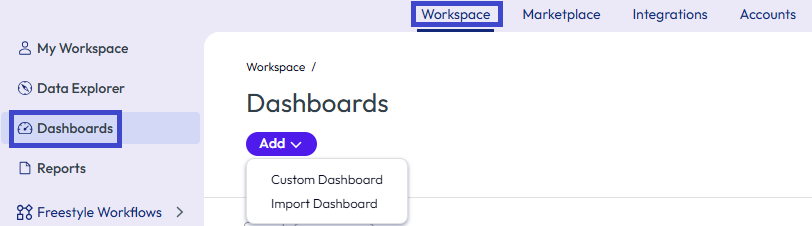
- In Intelligence, go to Workspace > Dashboards.
- Select the ellipses (...) for the desired dashboard, and then select Share.
- You can search for users from two sources.
- UEM Admin List View
- Azure AD Admin List View
Transferring ownership of dashboards
Admins with the Administrator permission, can transfer the ownership of dashboards. This feature is useful when your colleagues move on to other opportunities. Transfer the ownership of their Intelligence objects while they are off boarding to retain object management. For details on admins and Roles Based Access Control (RBAC) in Intelligence, see Accounts Management.
Finding unowned dashboards and transferring ownership
Admins can find unowned dashboards and assign ownership to other admins.
- In Intelligence, go to Workspace > Dashboards.
- Select the Unowned filter and deselect the Created By Me and Shared With Me filters.
- You can work with multiple dashboards or a single dashboard.
- Transfer from the Dashboards list page:
- Select to display dashboards in a list using the list view button.
- Select the check boxes of all the dashboards of which you want to transfer the ownership.
- You can use this option for both bulk transfer and single transfers.
- Transfer from the dashboard card: Select the ellipses (...) of the desired card.
- Transfer from the Dashboards list page:
- Select Transfer Ownership.
- Start to enter an admin user in the Transfer to owner text field, and select the user from the list.
The system emails the new admin owner of the dashboard.
Importing and exporting dashboards
Import and export dashboards to reduce the time needed to duplicate or reproduce similar dashboards across different organizations.
Note: The maximum import limit is 10 files.
Importing dashboards
- In Intelligence, go to Workspace > Dashboards.
- Select Add > Import Dashboard.
- Select the desired JSON file(s) and select Upload.
The console displays a message that reads Dashboard(s) uploaded successfully.
Exporting dashboards
- In Intelligence, go to Workspace > Dashboards.
- Select the ellipses (...) of the desired dashboard card.
- Select Export.
The console displays an Export Successful! message.
Configuring widgets
Dashboards categorizes widgets by the services integrated with Intelligence. For example, if you have registered Apteligent with Intelligence, you can select Apteligent widgets.
Configure the data widgets display with filters, charts and diagrams, and parameters. Change widget configurations at any time to view data differently.
Note: Historical data is not available for all widgets.
Procedure
- Navigate to Workspace > Dashboards and select a dashboard to work in. You can also select Add Widget from a dashboard in the Recent Dashboards area.
- Select a template or add a custom widget.
- Custom widgets require you to complete various parameters.
- Select a Category.
- Configure the Data Visualization area. To preview visualizations, scroll down the user interface.
- Complete the Snapshot data, which represents data in your deployment now.
- Chart Type: Horizontal, Vertical, Donut, Metric, or Table
- Measure - Average: Calculates the average of a selected group of values. This setting only works with numerical columns.
- Measure - Count: Sets the number of rows in a particular data set. The count is the simplest function for verifying results.
- Measure - Distinct Count: Returns a count of unique or distinct values identified over the data range set.
- Measure - Max: Returns the largest values in a particular data set. This setting only works with numerical columns.
- Measure - Min: Returns the smallest values in a particular data set. This setting only works with numerical columns.
- Of Key: Represents the data set you want aggregated by the Measure parameter.
- By Group: Separates data into groups. Widgets can display two groupings per data set.
- Results per group: Reduces the results displayed. For example, use a value of 10 to show data for a top 10 list of the most installed applications.
- Complete the Historical data, which represents data over time.
- Chart Type: Vertical, Line, or Table
- Measure - Average: Calculates the average of a selected group of values. This setting only works with numerical columns.
- Measure - Count: Sets the number of rows in a particular data set. The count is the simplest function for verifying results.
- Measure - Distinct Count: Returns a count of unique or distinct values identified over the data range set.
- Measure - Latest: Returns the latest values in a particular data set. The setting only works with numerical columns for chart types that are not Table.
- Measure - Max: Returns the largest values in a particular data set. This setting only works with numerical columns.
- Measure - Min: Returns the smallest values in a particular data set. This setting only works with numerical columns.
- Of Key: Represents the data set you want aggregated by the Measure parameter.
- Group by: Separates data into groups. Widgets can display two groupings per data set.
- Date Range: Sets a range in the past from which to pull and display data.
- Results per group: Reduces the results displayed. For example, use a value of 10 to show data for a top 10 list of the most installed applications.
- Complete the Snapshot data, which represents data in your deployment now.
- Select a Filter to define the baseline data sets for the widget. Use Add Rule and other parameters to define the data you want to see on your dashboard.
If the system has no information to display, it notifies you. However, you can change configurations to see if a different parameter, like Measure or Chart Type, can display your widget.
Widgets and color themes
In dashboards, you can customize widget color themes. The system displays color themes based on who owns the widget and with whom you've shared the widget.
- You can override a color theme of a widget shared with you. However, if you don't own the widget, only you see your chosen color theme.
- If you own a widget where you have changed its color theme and you share it, other viewers see the updated color theme.
- If you own a widget previously shared with others and you change the color theme, the system displays the new color theme to other users.
Widget overlays
Use widget overlays to overlay one chart over another to see two datasets in the same widget. With this feature you can easily compare trends and patterns, identify any outliers or anomalies and make data-driven decisions. Also, instead of having to create two widgets side-by-side, you can now overlay data from the same or different data sources in one widget.
Supported data types
Widget overlays support the Historical and Custom Trends data types. This support allows you to view two datasets over the same data range in one widget.
Supported chart types
You can overlay using the listed visualizations.
- Vertical and Line
- Line and Line
Configuring overlays
Add overlays during the regular, widget creation flow.
- Create a custom dashboard or add the widget to an existing dashboard. To create a custom dashboard, follow these steps.
- Navigate to Workspace > Dashboards and select a dashboard to work in. You can also select Add Widget from a dashboard in the Recent Dashboards area.
- Select Add > Custom Dashboard.
- Name the dashboard and Save it.
- Add a widget as the base of your widget overlay.
- In your custom dashboard, select Add Widget.
- Name the widget.
- Select a Data Source. For example, you can select Employee Experience > Apps.
- Complete the Chart Type section. For example, you can select the Vertical type.
- Complete the rest of the widget settings. Listed are some examples you can use.
- Select Measure as Count of Workspace ONE UEM Device GUID.
- Select Group by as Application Name.
- Select Results per group as 10.
- Select Date Range as Last 14 days.
- Select Frequency as 1 day.
- Add filters to narrow down your results.
- Add the second widget to overlay over the base widget.
- In your base widget, select Add Overlay.

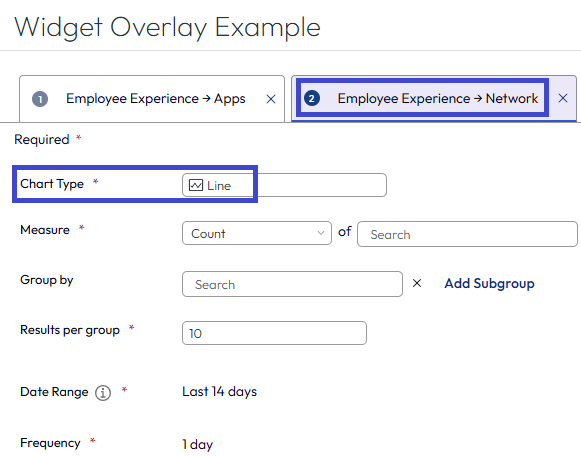
- The system displays the widget creation flow, and this process is similar to configuring base widgets with a few differences. Complete the second widget settings and notice that the second overlay uses Line as the Chart Type.
- Preview and save the widget overlay to your dashboard.
- In your base widget, select Add Overlay.
How do you remove overlays?
Remove an overlay by editing the widget.
- In Intelligence, go to Workspace > Dashboards and select the custom dashboard that includes the widget overlay.
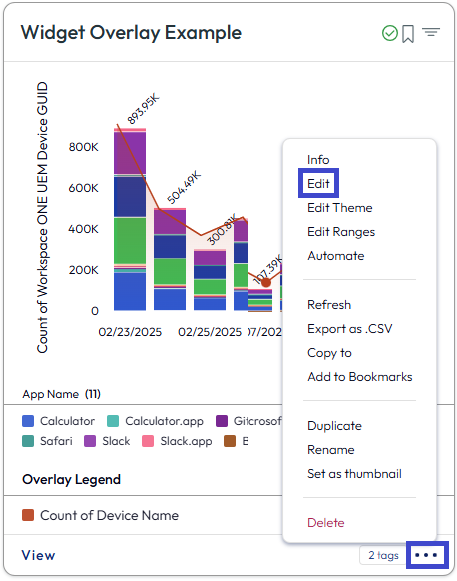
- Select the ellipses for the widget that includes the overlay and select Edit.
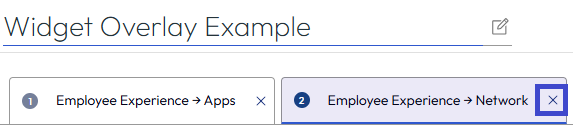
- Select the X to delete one of the widgets from the widget overly pair.
How do you see details for your widget overlay?
Select View on the widget to see the details of the widget overlay. Use the tabs for each widget to see details for that specific widget. Use the Manage Columns menu option at the bottom of the widget table to edit what columns display.
Unified Endpoint Management
Find dashboards for Apps, Devices, and OS Updates.
Apps
Use the Apps dashboard, found in Workspace > Unified Endpoint Management > Apps, to analyze application use for applications managed in your Workspace ONE environment and accessed through the catalog. The dashboard displays data for applications from Workspace ONE UEM, Omnissa Intelligence SDK, and Omnissa Access deployments.
Adoption and Engagement
The Apps dashboard helps determine if users adopt applications and if they use them. Low adoption has several causes. Is the application unnecessary? Is the application hard to use or does it have bugs?
Whatever the analysis, use the data on the dashboard to prioritize your application resources. Troubleshooting can reveal that the application is not worth the resources required to install and maintain it. Or perhaps, the application needs updating to the next version due to bug fixes.
Supported applications by integration
The Apps dashboard displays data for the listed application types.
- Integrations with Workspace ONE UEM support all managed applications.
- Integrations with the Intelligence SDK support internal applications that include the SDK and that are managed through Workspace ONE UEM. This integration supports some Workspace ONE productivity apps.
- Integrations with Workspace ONE Access support web applications accessed through the Omnissa Workspace ONE Intelligent Hub.
Workspace ONE productivity app analytics
The Apps dashboard displays data for some Workspace ONE productivity apps through their integration with the Omnissa Intelligence SDK. You do not need to configure anything in Intelligence in order to view the data in the Mobile Productivity Apps card. See analytics for App Usage (App Loads, MAU, and DAU), User Flows (App Start, App Load, and Custom Flows), Crash Rates, and Network Insights.
For a list of Workspace ONE productivity apps supported in user flows, see Supported User Flows.
How do you find Workspace ONE productivity apps data?
- In Intelligence, go to Workspace > Unified Endpoint Management > Apps.
- Select the Mobile Productivity Apps card to see the apps list.
- Select an app in the list to access the app details.
Supported productivity apps
| Workspace ONE Productivity App | App Name in Intelligence | Platform |
|---|---|---|
| Omnissa Workspace ONE Boxer | Boxer (Android) | Android |
| Omnissa Workspace ONE Boxer | Boxer (iOS) | iOS |
| Omnissa Workspace ONE Content | Android Content Locker | Android |
| Omnissa Workspace ONE Content | iOS Content Locker | iOS |
| Omnissa Workspace ONE Intelligent Hub | Android Agent | Android |
| Omnissa Workspace ONE Intelligent Hub | AirWatch Agent | iOS |
| Omnissa Workspace ONE Launcher | Android Launcher | Android |
| Omnissa Workspace ONE Web | Browser | Android |
| Omnissa Workspace ONE Web | Browser | iOS |
Devices
Use the Devices dashboard, found in Workspace > Unified Endpoint Management > Devices, to analyze various key indicators for mobile and desktop devices in your Workspace ONE UEM deployment.
Find lots of data to analyze and act on your Workspace ONE UEM devices. The main modules are Mobile Devices Dashboard and Desktop Devices Dashboard.
- The Mobile Devices Dashboard module displays various widgets to help you quickly see the use and health of your mobile devices fleet. Find information about enrolled users who are active and inactive. There is data about the health of device batteries and storage capacity. You can also see data about device ownership, device models, and their OS versions.
- The Desktop Devices Dashboard module not only displays widgets about the health of your desktop device deployment, it displays Experience Management telemetry. This module has Overview, Performance, and Errors tabs.
OS Updates
Use the OS Updates dashboard, found in Workspace > Workplace Security > OS Updates, to view version data for operating systems (OS) by platform. OS Updates data helps you know if your environment is fragmented and running older operating system on devices. For Windows Desktop, view all OS updates and patch updates.
OS Updates modules
The OS Updates dashboard includes all OS platform modules by default for your ease. In order to include an OS platform, the system must discover at least one device for that platform. The widgets display a unique number of OS versions across all enrolled devices and a total number of enrolled devices seen for that platform in your Intelligence environment. To see details into a specific platform, select View.
OS-Specific module information
Select View in an OS Updates module to get details for that operating system. A module displays two charts.
- Number of Devices by OS Version - This snapshot chart displays the number of enrolled devices seen in Intelligence for a specific OS version.
- Daily Active Devices by OS Version - This historical trend chart displays the number of active (devices that reported a sample) enrolled devices that were seen by OS version plotted for a specific day.
You can edit the filters to display particular data for longer or shorter time periods. To narrow the search you can select a specific Model or OS Version from filters.
Patches information
In the Windows Desktop module, the Patches tab lists data about patch update statuses for Windows including certain Microsoft applications as discovered from the Microsoft Updates channel. You can use filters to find data on patches using a specific knowledge base (KB) number, patch KB title, patch update classification, or date range.
The KB filters are useful when you want to know the status of a specific KB. The default view without edited filters, groups patches by the update status. Use the KB filters and the patch update status to determine the health of your Windows resources.
The count on the Patches tab shows the number of unique patches Intelligence detects. View two charts.
- Number of Patches by Update Status - This snapshot chart shows the Windows patch update status for all patches reported by enrolled devices.
- Number of Devices Updated by Status Over Time - This historical chart displays the number of enrolled devices seen by Intelligence (devices that reported a sample) by update status plotted for a specific day.
Windows patch status descriptions
| Status | Descriptions |
|---|---|
| Approved | The approved patch is successfully assigned to the device. |
| Assigned | The patch is approved and assigned to the device. |
| Available | The patch is available on the device for installation. |
| Failed | The patch failed to install. |
| Installed | The patch successfully installed. |
| Pending Installation | The patch installation is approved and available but not yet installed. |
| Pending Reboot | The patch installation is paused until the device reboots. |
| Removed | The patch is removed. |
| Unknown | The system is not receiving information about the patch. |
Workspace Security > Security Risk
View device security and events from your Workspace ONE UEM environment with the Security Risk dashboard. Find this content in Workspace > Workspace Security > Security Risk. For details on other Intelligence risk analytics like User Risk and Login Risk, see Risk Scoring
Security Risk modules
- Threats
- The Threats tab displays events identified by your Omnissa Workspace ONE UEM compliance engine as compromised.
- It also displays and aggregates events reported by your Trust Network services in the Threats Summary module.
- Policy Risks
- The Policy Risks tab displays events identified by your Workspace ONE UEM compliance engine that do not comply with configured policies. Events include devices with no passcode and devices that are not encrypted.
- Devices
- The Devices tab displays risk scores for devices managed in your Workspace ONE UEM environment.
- Select the tab to see device risk scores (reported as a level High, Medium, and Low), risk indicators, and to select single devices for analysis.
Time filter selected and percentages
Select a time period for the data displayed. The time selected affects the percentages displayed beside the risk modules. For example, selecting 14 days sets the percentage to reflect a comparison between now and 14 days ago. A negative percentage indicates that a risk has decreased, and a positive percentage indicates that a risk has increased.
Was this page helpful?