Guided RCA (gRCA) in Omnissa Intelligence assists you with debugging widespread, application crashes, OS crash issues, and slow boot events. Use this feature in your Omnissa Workspace ONE Experience Management deployments where you notice large, abnormal increases in events on macOS and Windows apps and devices.
Requirements
- The guided RCA (gRCA) feature works for macOS and Windows apps and devices.
- For Windows devices that use Experience Management for Horizon, gRCA supports the following use cases.
- The gRCA feature supports the Experience Management for Horizon use case Slow Logon Duration.
- For this feature to work for Horizon use cases, for example your Horizon Slow Logon Duration use case, your deployment must have a minimum of 25 unique Horizon sessions during the selected time range.
- For further details about this feature, see the section Explanation of the Slow Logon Duration gRCA.
- For Windows devices that use Experience Management for Horizon, gRCA supports the following use cases.
- The feature helps analyze application crashes, OS crashes (system crashes), and slow boot events.
- For results to display after running the gRCA, the gRCA date range must include at least 100 app crashes, system crashes, or slow boot events. For details about what constitutes a qualifying event, see the Why can I see 100 events but get no gRCA results? section.
- To work in production environments, this feature requires 100 or more devices.
Why can I see 100 events but get no gRCA results?
For gRCA to return results, the selected time window must include at least 100 unique, qualifying events for the metric being analyzed (for example, crashes or slow-logon sessions). However, the system registers only one unique, qualifying event for a device or session for a specific day.
Examples
- If a device experiences 10 OS crashes in one day, then the gRCA system registers 1 OS crash event for that device for that day.
- If a virtual session experiences 3 slow-logon sessions in one day, then the gRCA system registers 1 slow-logon event for that session for that day.
Let's look at a possible scenario where you can see 100 events but you get no gRCA results.
- Scenario: You see 100 OS crashes so you run an Investigation and look at the gRCA tab. The system returns no results even though there are 100 events. Even after you expand the gRCA data range to include 7 days, you still see no results.
- Explanation: The 100 OS crashes occurred on 10 devices in one day. The system lets each device register a unique, qualifying OS crash event for that day, so that is 10 unique, qualifying OS crash events for that day. If the 10 devices do not experience enough OS crashes to equal 100 events over the 7 days, then the gRCA system returns no results.
AI nutrition label
| AI Nutrition Facts | Guided Root Cause Analysis |
|---|---|
| Feature Name | Guided root cause analysis |
| Description | Finds possible root causes for the user in the Experience Management solution |
| Products | Experience Management |
| Model Type | Lift analysis |
| Model Provider | Internal |
| Input Data | Telemetry from Intelligence data lake |
| Input Data Available for Customer Audit | Not applicable |
| Adheres to Data Sovereignty | Yes |
| Trained on Customer Content | No |
| Guardrails | Not applicable |
| Update Frequency | Model is updated as needed |
| Data Retention Duration | See Intelligence data retention policy |
| Optionality | Required as part of Experience Management solution |
How can you use gRCA?
Use gRCA to help debug both widespread app crashes, system crashes, and slow booting devices. Guided RCA includes an algorithm that suggests statistically significant potential root causes. It is not guaranteed that the algorithm finds the root cause every time, however it should help you with knowing what to look for during the RCA process.
For information on how to create workflows that remediate your root cause findings, see the Freestyle Orchestrator topic.
Use advanced criteria to tune the RCA algorithm
You can use the Advanced Criteria to help the algorithm find possible causes for your investigations. Although selecting larger values of Lift Value or Support in the advanced criteria section can decrease the number of results in the analysis list view, it also can reduce the number of results that are not useful.
Tuning the advanced criteria parameters is optional but it is offered for those deployments that want to finely control the root cause analysis algorithm.
In the Advanced Criteria section, the UI lists the Features that your configured root cause analysis is checking for. Consider the features when you tune the advanced criteria parameters.
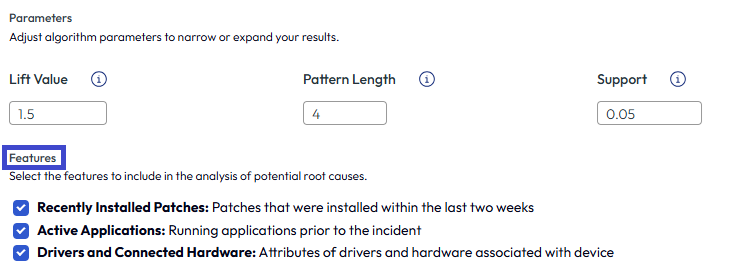
Advanced criteria parameter explanations
- Lift Value: A lift value represents how statistically confident the algorithm must be in the specific feature (for example OS Version or Recently Installed Patches) to consider events as potential root causes.
- If you raise the lift value, the algorithm might show less results because it has a higher confidence threshold that a result has to meet to be considered meaningful enough to show.
- Pattern Length: The pattern length refers to the number of related features the algorithm identifies as possibly contributing to the root cause.
- If you select
4, the algorithm displays up to 4 features (feature examples are Device Model, OS Version, App Version, and Recently Installed Patches) that when combined might be a root cause. - Using Patterns rather than just individual features, allows you to see complex patterns that might cause crashes like specific device models that only crash when they have had a specific patch installed and are running a certain app version.
- If you select
- Support: The support value is the required percentage of crashes that contain a specific feature for the algorithm to consider it significant and list it as a root cause.
- If you select
.05, this instructs the algorithm to consider a feature significant if it appears in 5% or more of the crashes.
- If you select
Types of gRCA metrics
Currently, gRCA helps to analyze app crashes, system crashes, and slow boot events. Each device can register one app crash per unique app, one system crash per day, and one slow boot per day. To run the algorithm, your deployment must experience over 100 of these unique crashes or slow boot events during the time range you selected when you configured gRCA.
Configure notifications for Insights
Use Notification Settings to send yourself an in app or email notification (or both) concerning Insights.
- Select the bell icon in the Intelligence header.
- In the Notifications panel, select the gear icon to access the Notification Settings page.
- Expand the Intelligence section and select In App or Email for the type of notification you want to receive for the listed services.
- App Insights: Notifies you about anomalies in apps on physical macOS and Windows machines.
- Device Insights: Notifies you about anomalies on physical macOS and Windows devices.
- User Insights: Notifies you about SSO login anomalies related to the Omnissa Access product.
- Virtual Insights: Notifies you about anomalies detected in your Experience Management for Horizon deployment.
- Programmatic Guided RCA: Notifies you when the system automatically runs a gRCA for an Insight.
Example gRCA configurations
This example outlines how to configure gRCA for a fictitious app called Acme Analytics to try to discover why the app is crashing. We'll work from creating the investigation to analyzing the root causes in a custom dashboard.
- Create an investigation in Intelligence.
You don't have to create an investigation. You can select an investigation in the list as explained in the next section of the example.- Go to Workspace > Experience Management > Experience Score > Desktop Apps > View.
- Select + Investigation.
- Enter the name of the app as the name of the investigation,
Acme Analytics. - Search for the name of the app (type
Acme), and select the app to add it as an object to the investigation. - Select Create Investigation.
- Check the performance indicators in the investigation after some time has passed.
- Go to Workspace > Experience Management > Investigations and select the
Acme Analyticsinvestigation from the list. - Select the Overview tab and go to the Performance Indicators section. You find the App Crash and App Crash Count events show increases in app crashes.
- Go to Workspace > Experience Management > Investigations and select the
- Work in the RCA tab of the investigation. Using gRCA, you create an app crash diagnosis for the system to use to find possible causes of the increase in crashes.
- Go to Workspace > Experience Management > Investigations and select the
Acme Analyticsinvestigation from the list. - Select the RCA tab and enter the values in the Root Cause Analysis area.
- Metric: Select App Crash.
- Range: Add the dates
Jun 17, 2025 - Jun 24, 2025. - Application: Enter
Acmeto search for the app and select theAcme Analyticsapp from the results list.
- Select Run Analysis.
- After the analysis completes, select the option to View Full Report.
- Go to the Results Summary to see a list of results that identify possible reasons for the spike in crashes of the
Acme Analyticsapp.- Find root causes you want to study further. Look for Useful root causes that have high numbers of crashes. The system ranks root causes differently, depending on the gRCA configurations and the data available.
- In this example, you work with two Types in the root cause list, App Version and Patch. Although these root causes do not display in the top three of Useful root causes, they have the highest number of crashes in the list.
- The example app version is
Acme Analytics-1.234.432.0 (11.01).- It is number 4 in the root cause list.
- The system reports that it has 229 crashes.
- This is the highest number of crashes in the root cause list.
- The example patch number is
1ABCD23EFG4H-Acme.Analytics.- It is number 12 in the root cause list.
- The system reports that it has 68 crashes.
- This is the second highest number of crashes in the root cause list.
- You can select the root cause item in the list to find Related Results.
- Use the Not useful check box for a root cause item in the list that you know did not cause the crashes. This check box removes the item from the list.
- Go to Workspace > Experience Management > Investigations and select the
- Create a custom dashboard to analyze if these events caused the spike in app crashes.
- Go to Workspace > Experience Management > Investigations and select the
Acme Analyticsinvestigation. - Select the Overview tab and go to the Related Dashboards section.
- Select Create Custom Dashboard.
- In the dashboard, select the ellipses (...) and choose Add Widget.
- Select Add Custom Widget.
Add three widgets to your custom dashboard. Create two of the widgets from the Employee Experience > Apps category and create the other widget from the Employee Experience > OS Updates category. - Create widgets one and two using the Category options in Employee Experience > Apps.
- Create the first widget with the Name > Application Start and Application Foreground.
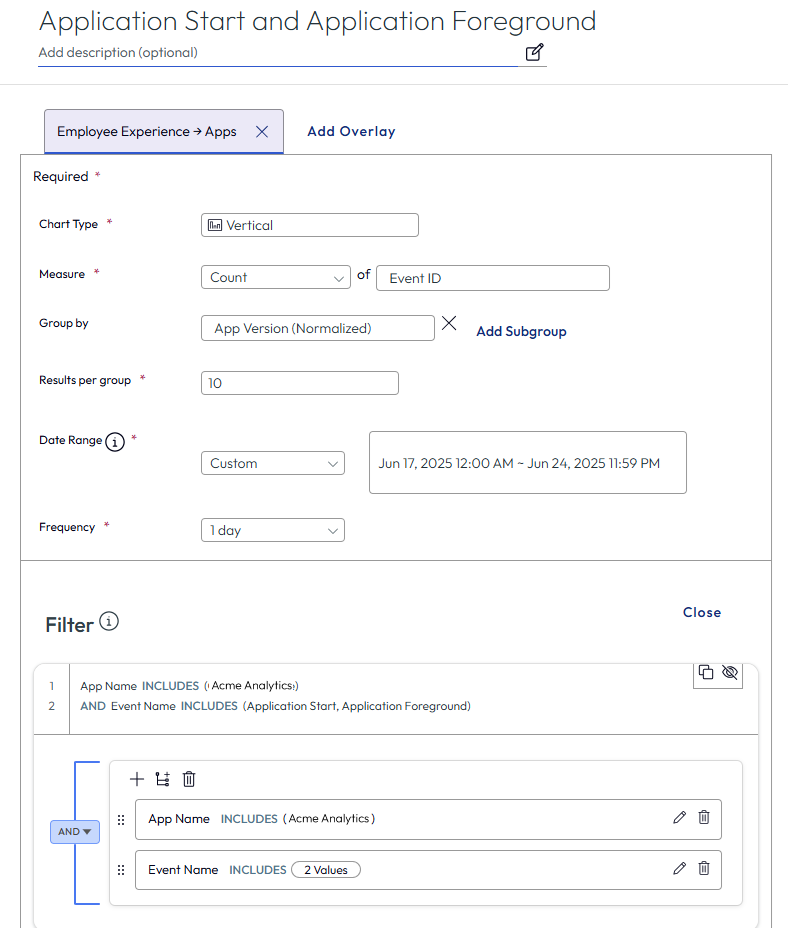
- Chart Type: Select Vertical.
- Measure: Select Count of Others > Event ID.
- Group by: Select Others > App Version.
- Results per group: Enter 10.
- Date Range: Select Custom with the range of Jun 17, 2025 12:00 AM - Jun 24, 2025 11:59 PM.
- Frequency: Select 1 day.
- Filter: Add two rules.
- Others > App Name includes
Acme Analytics - Others > Event Name includes Application Start and Application Foreground
- Others > App Name includes
- Create the second widget with the Name > App Crashes by App Version.
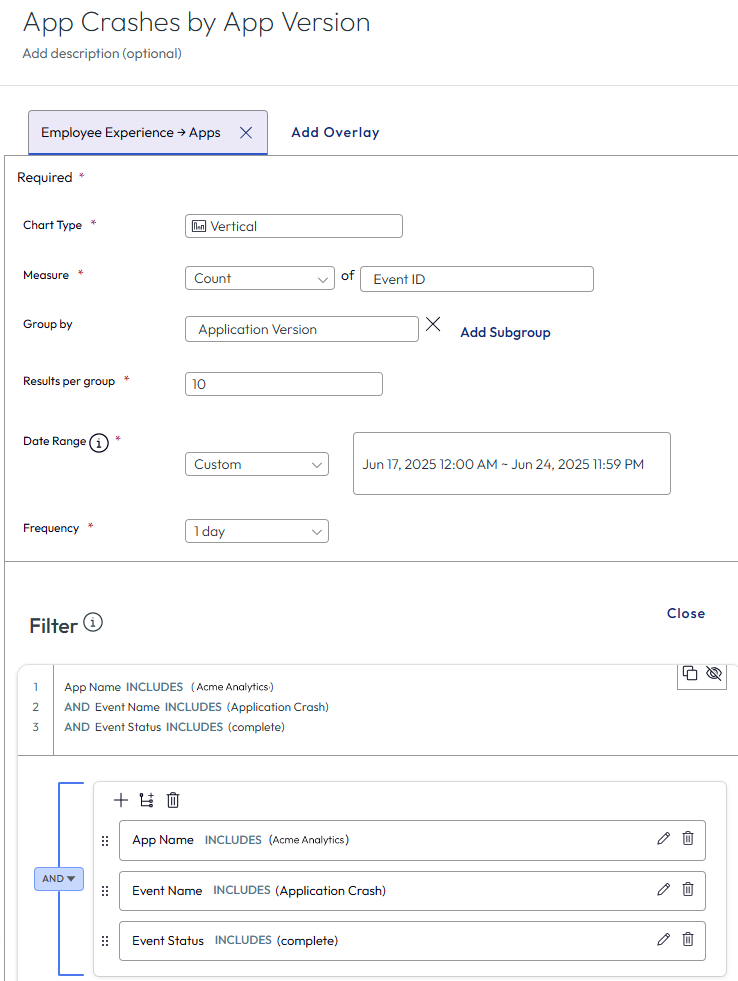
- Chart Type: Select Vertical.
- Measure: Select Count of Others > Event ID.
- Group by: Select Others > App Version.
- Results per group: Enter 10.
- Date Range: Select Custom with a range of Jun 17, 2025 12:00 AM - Jun 24, 2025 11:59 PM.
- Frequency: Select 1 day.
- Filter: Add three rules.
- Others > App Name includes
Acme Analytics - Others > Event Name includes Application Crash
- Others > Event Status includes complete
- Others > App Name includes
- Create the third widget using the Category options in Employee Experience > OS Updates.
- Name: Enter Problem Patch.
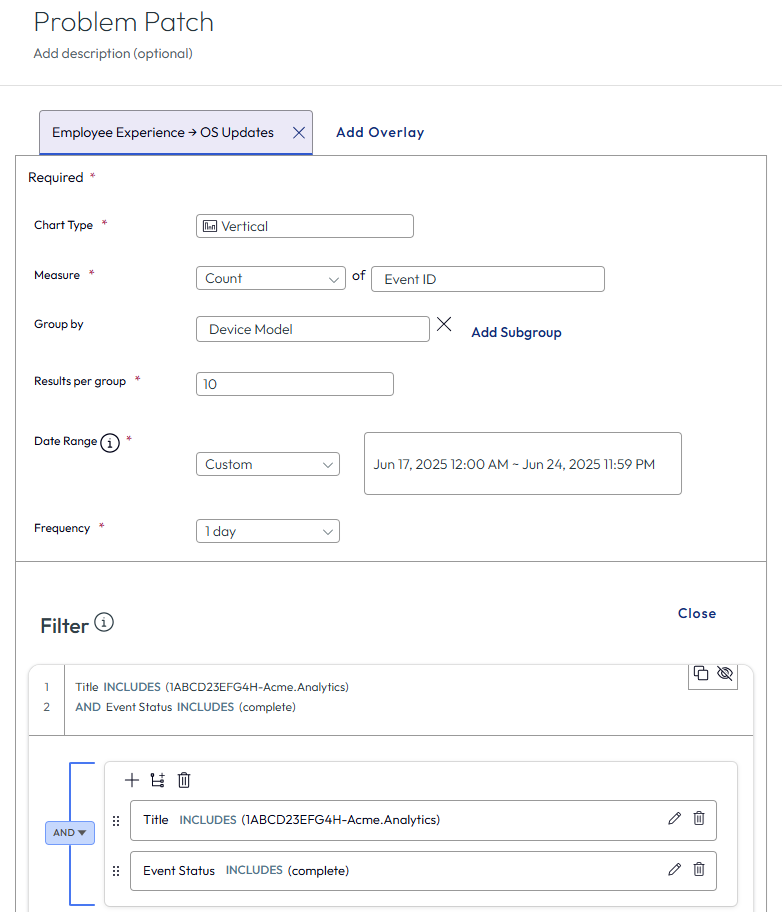
- Chart Type: Select Vertical.
- Measure: Select Distinct Count of Others > Event ID.
- Group by: Select Device > Device Model.
- Results per group: Enter 10.
- Date Range: Select Custom with a range of Jun 17, 2025 12:00 AM - Jun 24, 2025 11:59 PM.
- Frequency: Select 1 day.
- Filter: Add two rules.
- Others > Title includes the name of the patch,
1ABCD23EFG4H-Acme.Analytics - Others > Event Status includes complete
- Others > Title includes the name of the patch,
- Name: Enter Problem Patch.
- Create the first widget with the Name > Application Start and Application Foreground.
- Filter and view the widgets in your custom dashboard to further analyze why the
Acme Analyticsapp crashed.- Filter the Application Start and Application Foreground widget by the app version
Acme Analytics-1.234.432.0 (11.01).
You note that users started using this version of the app on September 14th. - Filter the App Crashes by App Version widget to display only the app version
Acme Analytics-1.234.432.0 (11.01).
You note that this app version reports the highest number of crash events. - Check the Problem Patch widget which identifies those devices that got the
1ABCD23EFG4H-Acme.Analyticspatch.
You note that many devices received this patch around September 14th. This date is the date that the app versionAcme Analytics-1.234.432.0 (11.01)began to crash as reported by the Application Start and Application Foreground widget. - Consider a possible remediation of rolling this version of the app back removing the patched version from devices.
- Filter the Application Start and Application Foreground widget by the app version
- Remediate the results found in the gRCA using workflows and use an action to remove the patched version of the app.
- Go to Workspace > Experience Management > Investigations and select the
Explanation of the Slow Logon Duration gRCA
For those who want to know how Omnissa develops Guided Root Cause Analyses (gRCAs) for events, let’s look at how the gRCA works for the Slow Logon Duration scenario for Experience Management for Horizon. Other gRCAs follow a similar approach, including relevant data attributes to identify patterns.
What does the Slow Logon Duration gRCA do?
Guided RCA uses an algorithm to look for patterns in the Horizon session data that may indicate root causes for logon duration issues. An example pattern would be the attributes Pool and Other Service Load Time.
Example: Slow Logon Duration Pattern = Pool attribute + Other Service Load Time attribute
The system identifies patterns that are important. A pattern is considered important when the number of occurrences of the pattern is statistically significant in affected sessions when compared to normal sessions.
Importance relates to the Lift Value
The Lift Value, an Advanced Criteria, controls the statistical confidence the gRCA engine requires to consider a pattern important. A lower Lift Value increases the probability the engine finds important patterns. A higher Lift Value decreases the probability the engine finds important patterns.
For example, if you set a lower Lift Value threshold for a Slow Logon Duration gRCA, you configure the gRCA engine to require less statistical confidence when identifying important patterns. With the lower statistical threshold, the engine might find more potentially important patterns.
Attributes for Slow Logon Duration
The gRCA for Slow Logon Duration uses the listed data attributes from your Experience Management for Horizon deployment.
| Raw Attribute | Friendly Name | Definition |
|---|---|---|
| edge_id | Edge ID | A value identifying the Horizon Edge deployment where the user initiated the session. Often, this value is the same value as the Edge Name. |
| edge_name | Edge Name | The name of the Horizon Edge deployment where the user initiated the session. Often, this value is the same value as the Edge ID. |
| event_timestamp | Event Time | The time the event occurred during the session. |
| horizon_session_user | User Name | The friendly name of the session's user. |
| s_da_logon_t_s | Logon Duration | This is the total logon duration value and it aids with the selection of the underlying data used in analysis. |
| s_logon_timestamp | Login Time | The time the user logged in to the session. |
| s_others_load_t_s | Other Service Load Time | The duration to complete the other-service-load-phase of the logon duration value. |
| s_prof_load_t_s | Profile Load Time | The duration to complete the profile load phase. |
| s_shl_st_t_s | Shell Start Time | The time to complete the start of the Shell application. |
| s_status | Session Status | The status of the session as reported at the time of initiation. |
| s_type | Session Type | The nature of a session. For example. the session can be an application or desktop session. |
| session_uuid | Session UUID | A uniquely generated value that tracks a user's activity for a session. |
| template_id | Pool ID | A value identifying the pool in which the session initiated. |
| template_name | Pool | The name of the pool in which the session initiated. |
| template_type | Pool Type | The type of pool in which the session initiated. |
| view_client_protocol | Client Protocol | The protocol associated with the session. Examples include BLAST, PCOIP, and RDP. |
| vm_id | VM ID | The uniquely generated value that identifies and tracks the session. |
| vm_osversion | OS Version | The OS version of the virtual machine initiating the session. |
Was this page helpful?