September 1, 2026

Available Telemetry and Management Features

The Experience Management for Horizon system, provided within Omnissa Workspace ONE Experience Management, displays various telemetry data that you can use to monitor, analyze, and troubleshoot your Horizon Cloud deployment in Omnissa Intelligence. Find data for your organizations, Horizon sessions, management components (connection servers and the UAG), and apps within dashboards and reports. Use Freestyle workflows to remediate poor employee experiences.

Organization

The Organization Experience Score depicts scores for your resources, which are a compilation of individual user scores and Horizon sessions scores.

Organization Experience Scores are measured every four hours using the metrics of Poor, Neutral, and Good.

Use this dashboard to quickly check the health of your Experience Management for Horizon environment. To find the possible causes for issues, use the Horizon Sessions and Apps dashboards.
This organization experience score reports a poor experience for the organization per total active users and horizon sessions.

Horizon Sessions

Horizon Sessions include the Login Experience, Network/Protocol, and VM Performance metrics. Horizon Sessions Scores are measured for the last four hours using the metrics of Poor, Neutral, and Good. Use these areas to find possible issues in your Horizon environment.
Find scores for your Horizon sessions that include logon scores, network and protocol scores, and VM performance scores.

Extended support to RDSH

In your Horizon Sessions area, in the All Sessions list, you can find data for RDSH desktops and apps. In the past, this area only displayed session data for VDI desktops and apps. A session with an RDSH desktop or app has the label Multiple Sessions. You can select the desired Multiple Sessions in the list and find information about session performance that includes CPU use, memory use, and a list of RDSH applications and desktops for that session.

Logon Experience

Logon experience score is calculated for the last four hours over the total sessions, and it includes widgets for Logon Duration Score, Logon Duration by Phase, and Pools with Longest Logon Duration.

Logon Duration depicts the experience for waiting for all the log on processes to complete. A quicker log on equals a better experience score.

Use the Logon Duration by Phase to see where in the logon process sessions experience the most time, during GPO Load, Profile Load, Shell Load, or Other.

Like logon duration scores, pools with quicker logon duration metrics represent a better experience.
The further down the list, the better logon experience in the Pools with the Longest Logon Duration widget.

Network/Protocol Score

Network/Protocol performance is measured for the last four hours over the total number of sessions and it is comprised of the listed data points.

  • Protocol Packet Loss
  • LAN Latency
  • WAN Latency
  • Wi-Fi Signal Strength (This data is applicable to Horizon Cloud and not Horizon First-Gen.)
  • Protocol Latency

To find offenders, drill down to where you see poor scores. In the screenshot, the Protocol Packet Loss metric displays a poor score. Select this metric and find the user and pool or farm name that is experiencing the issue.
See data pertaining to your Horizon network and protocol performance by selecting the Virtual tab.

VM Performance Score

VM Performance is measured for the last four hours for a total number of sessions, and it includes the listed metrics.

  • CPU Usage
  • Disk IOPS
  • Memory Usage
  • Disk Latency

To find VM performance offenders, look for poor or neutral scores and drill down into these areas. In the screenshot, Disk Latency has a neutral score.
Let's look at Disk Latency to see what is causing a neutral VM performance.

If you select Disk Latency, you can add a filter rule to see the top offenders of High Average CPU Usage.

  • Select the Last 4 hours for the time.
  • Select the edit icon, and add a filter for Disk Latency Score > Equals > Neutral and apply the filter.
  • Sort the Disk Latency column to display from highest to lowest.
  • User 1 experienced sub-optimal disk latency for the last four hours. You can select the user name to get even more data on the session for User 1.
    Add a filter rule to help find disk latency scores for VM performance.

Per Horizon Sessions Performance

Use the Per Horizon Sessions Performance dashboards to analyze single sessions that have poor experiences. To find a per Horizon Sessions Performance dashboard, go to Workspace > Experience Management > Experience Score, select the Virtual tab, select the Horizon Sessions tab, and select the User Name in the All Sessions table for the session you want to analyze.
Use the User Name of the person's session to get to the per session data.

On the Overview > Timeline tab, you can find information for the listed system and app data points. Performance trendline graphs include average and maximum values.

  • CPU
  • Disk IOPS
  • Disk Latency
  • LAN Latency & WAN Latency
  • Memory
  • Protocol Latency
  • Protocol Packet Loss
  • Wi-FI Signal Strength


Find out about system and app CPU and memory usage and find offending apps for each session.

Management Components

Use the Management Components dashboard to analyze the health of your Horizon Connection Servers and your Unified Access Gateway (UAG) appliances.

Note: This tile works for only Horizon Enterprise deployments. If your Horizon deployment includes Horizon Cloud on Microsoft Azure, then the Management Components tile does not display data for the Microsoft Azure deployment.

The Management Component dashboard contains a score breakdown and analytics for connection servers and UAG appliances.

Horizon Connection Servers authenticate Horizon client connections. The Omnissa Unified Access Gateway (UAG) secures external access to applications. These components help ensure secure access out of and in to your Horizon Enterprise deployment. Analyze their health to help troubleshoot events and to gain insight for possible performance optimization.

Score Breakdown

The Score Breakdown area offers a high-level visual of the health of your connection servers and UAGs. The data points that the system gathers to contribute to the Score Breakdown include status, certificate expiration, CPU, memory, sessions, and connections.

If a contributor has a higher Poor Score and red in the Score Summary line, select the specific contributor and use the specific contributor dashboard to discover when during the set time range the contributor experienced the issue that caused the Poor score.

Scores are calculated every four hours against the set thresholds. If you want to change thresholds, see How do you control thresholds for Horizon telemetry? for details.

Components

The Components area displays analytics to help you analyze the memory usage and capacity of your connection servers and UAGs.

Trends
Select the Connection Servers or UAG Appliances tab to see the trends in capacity and performance. Neutral trends are not bad, but suggest that there is room to optimize CPU or memory for a more favorable experience. Downward or poor trends identify that usage has been taxing the deployment over the selected time range. Upward or favorable trends report that the deployment is not over burdened and the components are well optimized.

  • Connection Servers
    Image of the connection server tab in the Components area where you can select to view CPU and look for possible issues.
    • CPU - Displays all connection servers and their trends in CPU used. For example, the connection server in the picture, WDC-VCM01B has a neutral overall score for CPU. The line graphs trend downward and upward. This connection server seems to have room for improvement in the Memory Usage category. The next step can be to select that connection server and see its specific trend dashboard for more data.
    • Memory - Displays all connection servers and their trends in memory used.
    • Sessions - Displays all connection servers and their trends in sessions.
  • UAG Appliances
    • CPU - Displays all UAGs and their trends in CPU used.
    • Memory - Displays all UAGs and their trends in memory used.
    • Connections - Displays all UAGs and their trends in number of connections.

Specific trend dashboards
Find data for the Experience Score and at-a-glance information (name, build number, IP address, and other data) on the component-specific trend dashboard. You can also find lists of events, statuses, and performance information.

Note: Some data in the specific trend dashboards are averages rather than unique values.

  • Events - Find specific events and when they occurred for troubleshooting poor and neutral experiences.
  • Status - See the status of the connection server or UAG appliance with a list of events and dates.
  • Performance - Find when peak CPU use happens, when memory usage spikes, and when sessions or connections increase too close to capacity. Use the Scale to highest value toggle to help with viewing Performance graph lines.

Apps

Apps Performance is measured for the last four hours over the total number of apps and it includes the following metrics.

  • App Score
  • App Crash
  • App Hang

Use this area to check for high CPU and memory usage caused by apps. Sort the All Apps list by CPU to find the apps using the most CPU. In the screenshot, App ABC is using the most CPU.

Select the app in the list to drill down to see more information on CPU, memory, app crashes, and app hangs for the specific app.

Omnissa App Volumes integration

Experience Management for Horizon identifies if an app was installed locally or if it was installed by App Volumes.

App Volumes is an app delivery and management system. For ease of use and for availability, organizations can push important and useful apps to devices so that users can perform job tasks and be productive. However, there are some instances where users install apps without using App Volumes. Use the Installation column in the All Apps list to find the apps that users installed locally and the apps that users installed through App Volumes.

In the Installation column, find two statuses that identify the app's installation source.

  • Locally Installed - Identifies an app that was installed by the user and not by App Volumes.
  • App Volumes - Identifies an app that was delivered by App Volumes.
  • Multiple Delivery - Identifies an app where some users use the version delivered by App Volumes, while others use a locally installed version.
    An image of the Installation column with examples of apps that were locally installed and delivered by App Volumes.

How do you control thresholds for Horizon telemetry?

You can control the system's tolerance when calculating experience scores by tuning Thresholds.

Notes:

  • After you change a threshold, wait at most four hours for the system to calculate the new, incoming data with the edited threshold values.
  • The new threshold values do not impact the scores the system has previously calculated.

Procedure

  1. In Intelligence, go to Workspace > Experience Management > Experience Score.
  2. Select Thresholds in the top right of the UI.
  3. To view experience scores, select the Virtual Session and Virtual Experience filters.
  4. You can customize the experience score thresholds by entering values directly in the value boxes above the green, yellow, and red threshold bars.

Using workflows (Freestyle)

You can trigger workflows for your Experience Management for Horizon environment using the Intelligence > Horizon Experience attributes as the data sources.
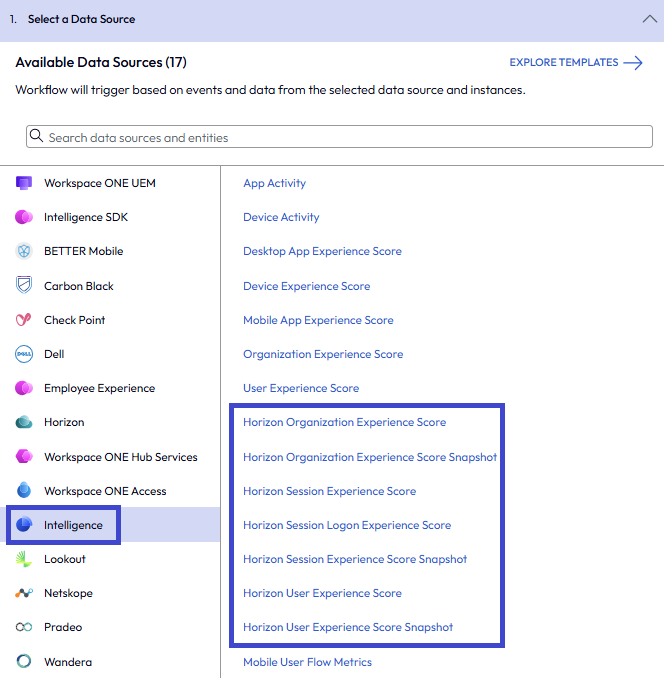
When choosing the data source for a workflow, select Intelligence and then select a Horizon Experience score for organizations, sessions, or users.

Case 1: Alert for poor Horizon Organization Experience Score

Send an email or Slack alert or trigger a ServiceNow ticket when the system identifies that an organization's experience is Poor.

  1. In Intelligence, go to Workspace > Freestyle > General and select Add Workflow.
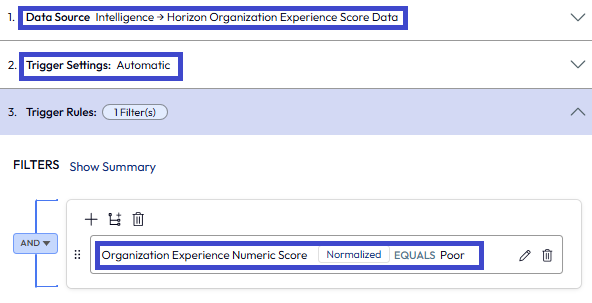
  2. Select Intelligence as the Data Source, and then select Horizon Organization Experience Score.
  3. Select Automatic as the Trigger Settings.
  4. Complete the Trigger Rules.
    • Select the attribute Horizon Organization Experience Score > Organization Experience Numeric Score (Normalized).
    • Select Equals as the operator.
    • Select Poor as the value.
      Configure the triggers to set the workflow engine to identify poor organization experiences.
  5. Drag and drop the Action button below the Workflow Settings.
  6. Select Intelligence > Send Email, and then select Add Action. Other options include to use Slack Web API or ServiceNow actions if you have integrated these services with Intelligence.
  7. Enter the email information for the admin you want to receive notifications about poor experience scores.
  8. Save the workflow.
  9. Select Enable Workflow to start using the workflow on incoming data or you can wait to activate the workflow later. The system executes the workflow when incoming events match the trigger rule.

Case 2: Alert for poor Logon Experience

You can use workflows to proactively track Horizon session, logon performance for users to identify wide-spread issues that impact performance and the user experience.

  1. In Intelligence, go to Workspace > Freestyle > General and select Add Workflow.
  2. Select Intelligence as the Data Source, and then select Horizon Organization Experience Score Snapshot.
  3. Select Automatic as the Trigger Settings.
  4. Complete the Trigger Rules.
    • Select the attribute Horizon Organization Experience Score Snapshot > New Sessions With Poor Logon Score Percentage.
    • Select Greater than or equal to as the operator.
    • Enter 30 as the value to represent new sessions with poor logon score percentages of 30%.
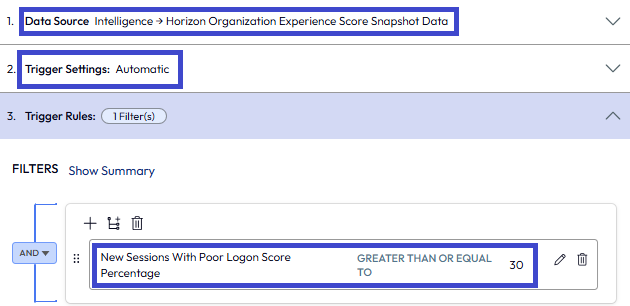
      Configure the triggers to set the workflow engine to identify poor logon experiences.
  5. Drag and drop the Action button below the Workflow Settings.
  6. Select Intelligence > Send Email, and then select Add Action. Other options include to use Slack Web API or ServiceNow actions if you have integrated these services with Intelligence.
  7. Enter the email information for the admin you want to receive notifications about poor user experiences.
  8. Save the workflow.
  9. Select Enable Workflow to start using the workflow on incoming data or you can wait to activate the workflow later. The system executes the workflow when incoming events match the trigger rule.

Was this page helpful?

Provide feedback for this topic

Was this topic helpful?

Please do not include any personal or confidential information.

Generating link…