Insights detect anomalies in your Omnissa Workspace ONE Experience Management environment. They are a machine-learning based feature that alert you to interesting or potentially problematic data point changes without you having to constantly monitor your dashboards.
How do Insights work?
The Insights algorithm creates a baseline of normal behavior for each data point in your Experience Management environment. The algorithm adjusts the normal range as rates go up or down. For example, if an app’s crash count begins to trend down over time, the algorithm identifies that the app has gotten more stable and changes what it considers normal, accordingly.
AI nutrition label
| AI Nutrition Facts | Insights |
|---|---|
| Feature Name | Insights |
| Description | Anomaly detection in the Experience Management solution |
| Products | Experience Management |
| Model Type | Time series anomaly detection |
| Model Provider | Internal |
| Input Data | Telemetry from Intelligence data lake |
| Input Data Available for Customer Audit | Not applicable |
| Adheres to Data Sovereignty | Yes |
| Trained on Customer Content | Yes, anonymized |
| Guardrails | Not applicable |
| Update Frequency | Models are retrained weekly |
| Data Retention Duration | See Intelligence data retention policy |
| Optionality | Required as part of Experience Management solution |
Where do you find Insights?
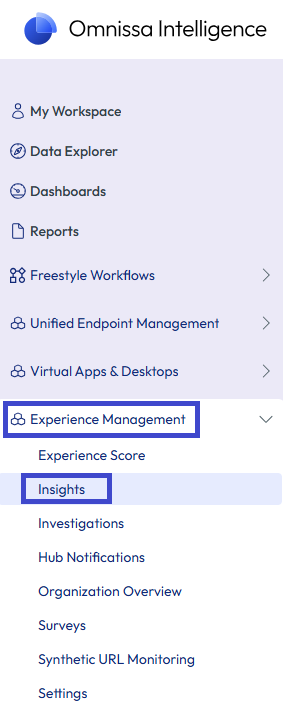
If Omnissa Intelligence has detected anomalies, you can find Insights in Workspace > Experience Management > Insights.
Better Insights as device numbers increase
With default settings, Insights are typically most effective when telemetry is available from at least a few hundred, active devices. Smaller device populations can produce fewer or less stable Insights. As the number of devices increases, Insight quality and reliability improves.
What can you do from an Insights card?
You can perform several actions from an Insights card when you select the card's arrow (>).
- Create Investigation - Create an Investigation for the Insight.
- Add Comment - Add a comment for other admins to see and use for analysis. You can use the comments to filter Insights with the Last Commented menu option in the What would you like to work on? section.
- Dismiss - Select Dismiss to put the Insight into an archived state.
- The system manages the status, Active or Dismissed, based on the user. For example, Admin A can dismiss an Insight, and that same Insight still displays for Admin B.
- The procedure for reactivating your Insights is similar to dismissing them.
- Use the filter beside the search field to view Dismissed Insights.
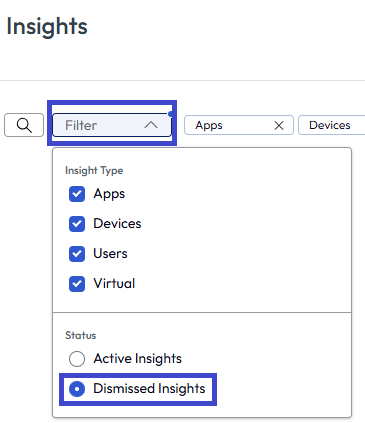
- Find the applicable dismissed Insight in the list and select its arrow (>).
- Select Make Active.
- Use the filter beside the search field to view Dismissed Insights.
- Impacted Devices - You can see the percentage of devices that are impacted by the Insight and how many of those impacted devices are active.
- Select View Devices to see all impacted devices listed by device name.
- The Devices tab lists devices impacted by the Insight.
- For the devices category, the Impact by OS Version tab displays OS versions impacted by the Insight.
- For the apps category, the Impact by App Version tab displays the app versions impacted by the Insight.
- Insight chart - See Insight data points over time.
- The normal range of the data point, generated by the algorithm using historical data, is shaded in blue.
- The current value of the data point is depicted with a solid blue line.
- If there is a gap in the shaded region, the gap identifies that no data was reported for that time period.
- Timeline - This widget shows when the system created the Insight and every period that the Insight was continuously anomalous.
How can you control Insight sensitivity?
You can control the sensitivity and minimum thresholds of the Insight mechanism by using the Insights tab in Experience Management > Settings. 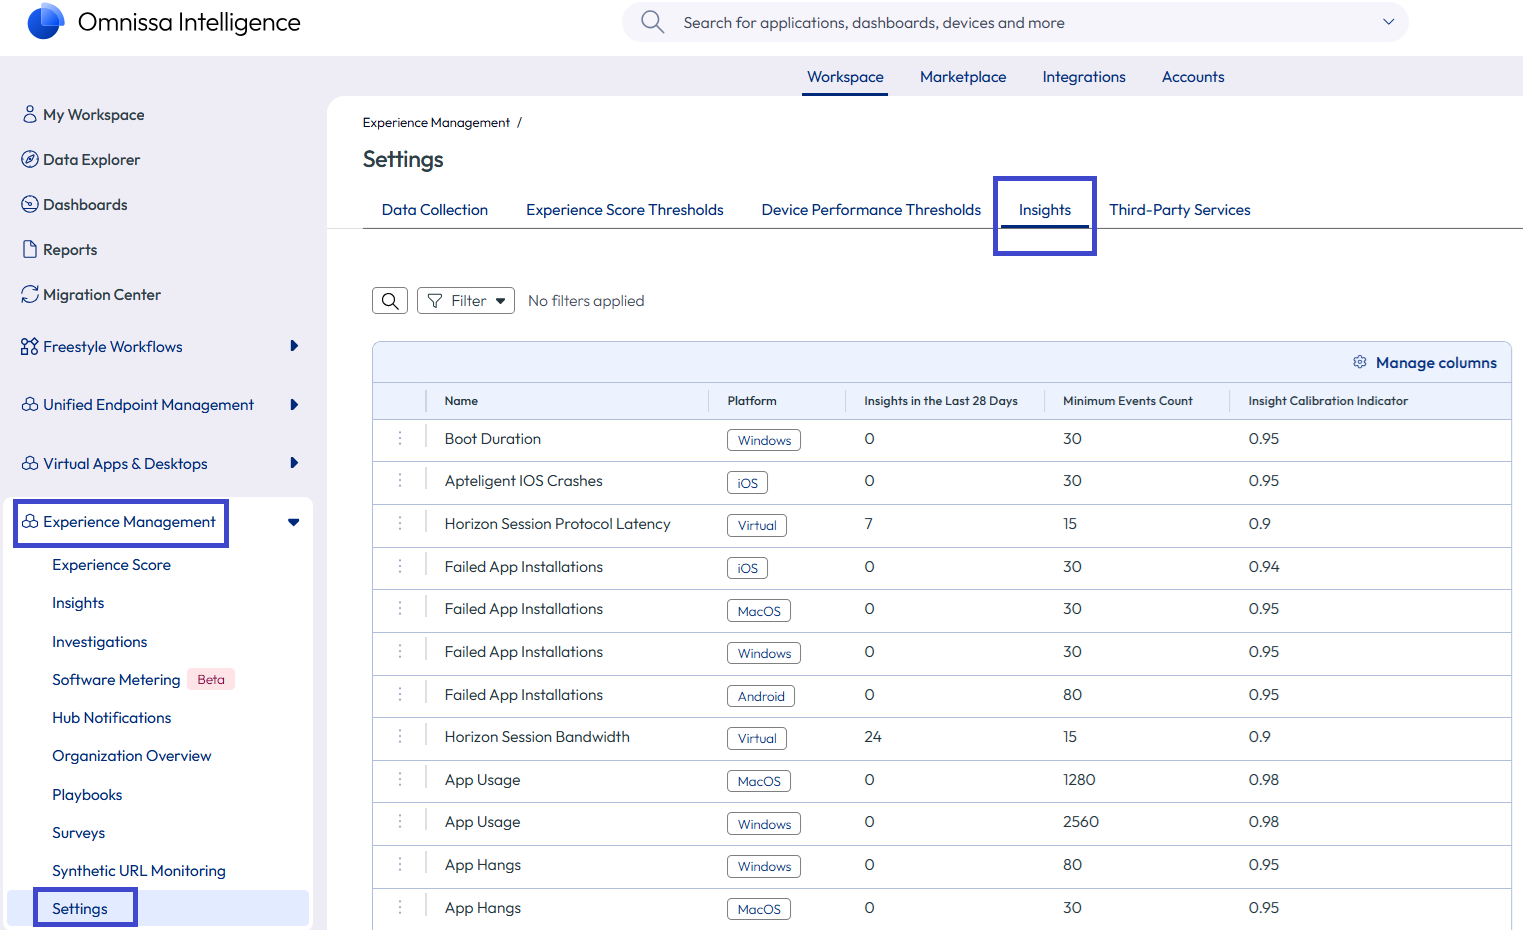
These thresholds are useful if your system is getting inundated with Insights or if a business area needs more scrutiny by the Insights engine. To configure the sensitivity of an Insight, use the Insights list to edit the threshold.
- Go to Experience Management > Settings and select the Insights tab.
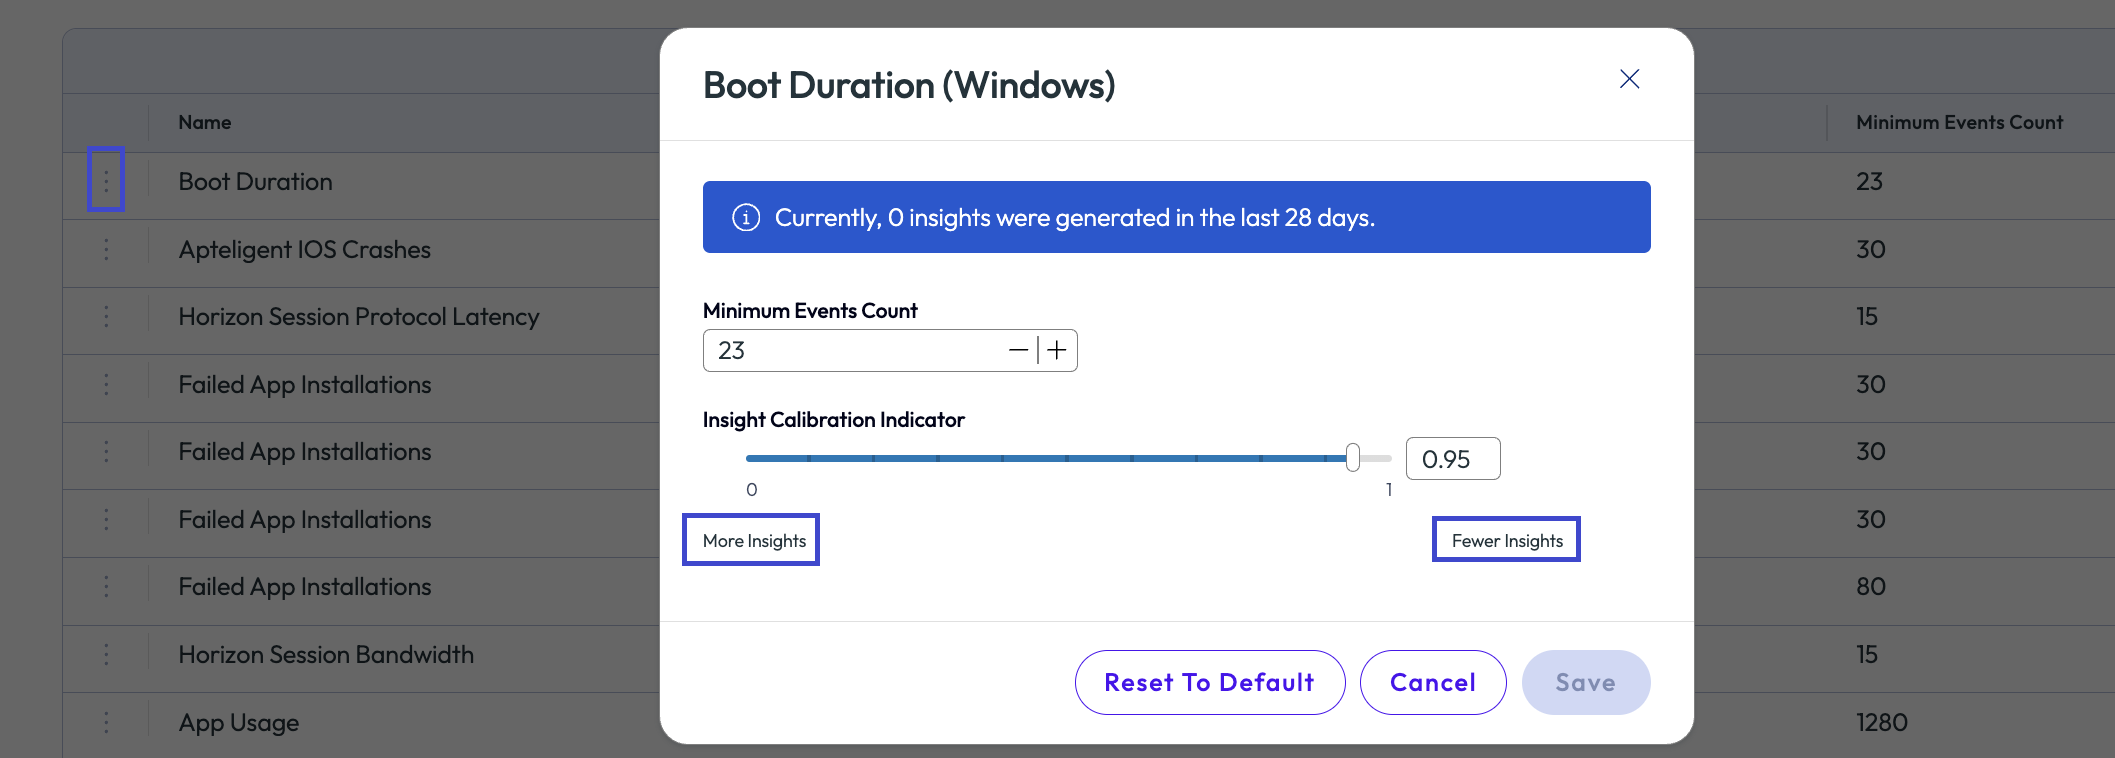
- Select the three vertical dots beside the applicable Insight, and then select Edit.
- Use the Insight's threshold card to configure the number of event counts, to increase or decrease the calibration, or to restore Insight calibration to the default settings.
What data points do Insights monitor?
| Data Point | Description | Example | Data Point Source |
|---|---|---|---|
| App Crash | Number of crashes per app in 1-hour increments. | System generates an Insight that an app has begun to crash at a high rate in the last hour, and it is impacting productivity. | Omnissa Workspace ONE Experience Management |
| App Hang | Number of hangs per app in 1-hour increments. | System generates an Insight that an app has begun to hang and has decreased productivity. | Omnissa Workspace ONE Experience Management |
| App Install Failure | Number of failed installations for a given application in 1-hour increments. | System generates an Insight that an app has failed to install at a higher rate than normal in the last hour. | Omnissa Workspace ONE UEM |
| App Usage | Number of foreground events per app in 1-hour increments. Covers Windows, macOS, and Horizon application usage. | System generates an Insight that an app is launching more frequently than normal. | Omnissa Workspace ONE Experience Management |
| Battery State Changes (iOS and Android) | Number of battery events in 1-hour increments. | System generates an Insight If a group of devices starts flipping between charging and discharging more than normal, it's usually a faulty/non-standard charger. | Omnissa Intelligence SDK |
| Boot Duration | The median boot duration in 1-hour increments. | System generates an Insight that the median boot duration has increased. This increase indicates that there is a widespread degradation of boot performance. | Omnissa Workspace ONE Experience Management |
| CPU Utilization | The median CPU utilization in 1-hour increments. | System generates an Insight that the median CPU utilization has increased meaning some app, recently deployed, is causing abnormally high resource requirements. | Omnissa Workspace ONE Experience Management |
| Failed SSO Logins | Number of Failed SSO Logins in 1-hour increments. | System generates an Insight that a higher than normal SSO Login Failure count has been registered which means employees may not be able to access company resources. | Omnissa Access |
| High Connection Count on Unified Access Gateway | The connection count across Unified Access Gateway appliances in 1-hour increments. | System generates an Insight that the number of connections the Unified Access Gateway appliances are handling has risen above its normal range — often an early sign of a load-balancing problem, an appliance outage, or demand outstripping capacity. Reported for the environment as a whole. | Omnissa Workspace ONE Experience Management |
| High CPU Utilization on Unified Access Gateway | The median CPU utilization across Unified Access Gateway appliances in 1-hour increments. | System generates an Insight that CPU use across the Unified Access Gateway appliances has risen above its normal range, which can degrade connection brokering for every user behind the gateway even while every per-desktop metric looks healthy. Reported for the environment as a whole. | Omnissa Workspace ONE Experience Management |
| High CPU Utilization on Virtual Machines | The median CPU utilization across Horizon virtual machines in 1-hour increments. The system counts only VMs with an active session. | System generates an Insight that CPU use across the Horizon VMs has risen above its normal range. | Omnissa Workspace ONE Experience Management |
| High Disk Latency on Virtual Machines | The median storage disk latency across Horizon virtual machines in 1-hour increments. | System generates an Insight that storage disk latency across the Horizon VMs has risen above its normal range — often the cause of a desktop that feels slow with no other metric looking obviously wrong. | Omnissa Workspace ONE Experience Management |
| High Memory Utilization on Virtual Machines | The median memory utilization across Horizon virtual machines in 1-hour increments. | System generates an Insight that memory use across the Horizon VMs has risen above its normal range, letting an analyst associate the affected VMs with a particular desktop pool. | Omnissa Workspace ONE Experience Management |
| Horizon Session Bandwidth | The median of session bandwidth (transmitted bytes) in 1-hour windows. | System generates an Insight that the median session bandwidth spiked. | Omnissa Workspace ONE Experience Management |
| Horizon Session Latency | The median protocol latency in 1-hour windows. | System generates an Insight that the median protocol latency across all Horizon sessions spiked. | Omnissa Workspace ONE Experience Management |
| Horizon Session Logon Duration | The median logon duration in 1-hour increments. | System generates an Insight that the median logon duration has increased. This increase indicates that there is a widespread degradation of logon performance. | Omnissa Workspace ONE Experience Management |
| Horizon Session Packet Loss | The count of non-zero packet loss sessions in 1-hour windows. | System generates an Insight when the total amount of sessions with packet loss increases beyond normal values for a given hour. | Omnissa Workspace ONE Experience Management |
| Intelligence SDK Crashes (iOS and Android) | Number of crashes per app in 1-hour increments coming from apps with the Intelligence SDK. | System generates an Insight that an app has begun to crash at a high rate in the last hour, and it is impacting productivity. | Omnissa Intelligence SDK |
| Intelligence SDK Network Errors (iOS and Android) | Number of network errors in 1-hour increments coming from apps with the Intelligence SDK. | System generates an Insight when a higher than normal amount of Network errors have been registered in apps with the Intelligence SDK. | Omnissa Intelligence SDK |
| Network State Changes (iOS and Android) | Number of network state change events in 1-hour increments. | System generates an Insight when a device's network events suddenly increase or decrease at the organization or platform level. A spike usually means devices are flipping between networks (Wi-Fi to cellular, 5G to 4G) faster than normal. A drop usually means a network outage upstream. | Omnissa Intelligence SDK |
| OS Crash | Number of OS crashes in 1-hour increments. | System generates an Insight that OS Crashes have increased past normal amounts. This increase indicates a widespread BSoD (blue screen of death) issue. | Omnissa Workspace ONE Experience Management |
| Poor Network Signal (Android) | Number of poor signal network events in 1-hour increments. | System generates an Insight when more devices than usual start reporting weak cellular signal (1-2 bars). Sometimes identifiable before it shows up as a wave of help desk tickets. Get ahead of the carrier conversation and pinpoint which locations are affected. | Omnissa Intelligence SDK |
| Shutdown Duration | The median shutdown in 1-hour increments. | System generates an Insight that the median shutdown duration has increased. This increase indicates that there is a widespread degradation of shutdown performance. | Omnissa Workspace ONE Experience Management |
| User Flow Completion Time (iOS and Android) | The median duration of a user flow time in ms in 1-hour windows. User flows track key workflows inside Omnissa Intelligence SDK apps. The system orders them by organization, platform, app, and flow name. | System generates an Insight when a completion time spikes, so you can catch slowdowns (like network issues at a warehouse causing checkout timeouts) before they pile up in support tickets. | Omnissa Intelligence SDK |
| User Flow Failures (iOS and Android) | Number of failed flows in 1-hour windows. User flows track key workflows inside Omnissa Intelligence SDK apps. The system orders them by organization, platform, app, and flow name. | System generates an Insight when a flow's failure rate spikes, so you can catch slowdowns (like network issues at a warehouse causing checkout timeouts) before they pile up in support tickets. | Omnissa Intelligence SDK |
Was this page helpful?