Omnissa Workspace ONE Experience Management and Omnissa Intelligence have updated how they score device experiences from the legacy Risk Scoring, threshold-based model to a machine learning (ML) model to help you proactively identify slow and underperforming devices before users raise support tickets. Learn how the scoring model works, where the dashboard is and what metrics are available, how to find contributor data, and how to configure scoring groups.
Limited availability
Omnissa Workspace ONE Experience Management and Omnissa Intelligence offer Device Experience Score with limited availability. These features are available to a limited number of customers for extended feedback.
How Device Experience Score works
The Device Experience Score feature uses machine learning, not fixed thresholds. Scores are relative to your organization's own device baseline, not an industry benchmark. The feature includes components like contextual scoring, scoring groups, metric inputs and weights, and weekly refreshes.
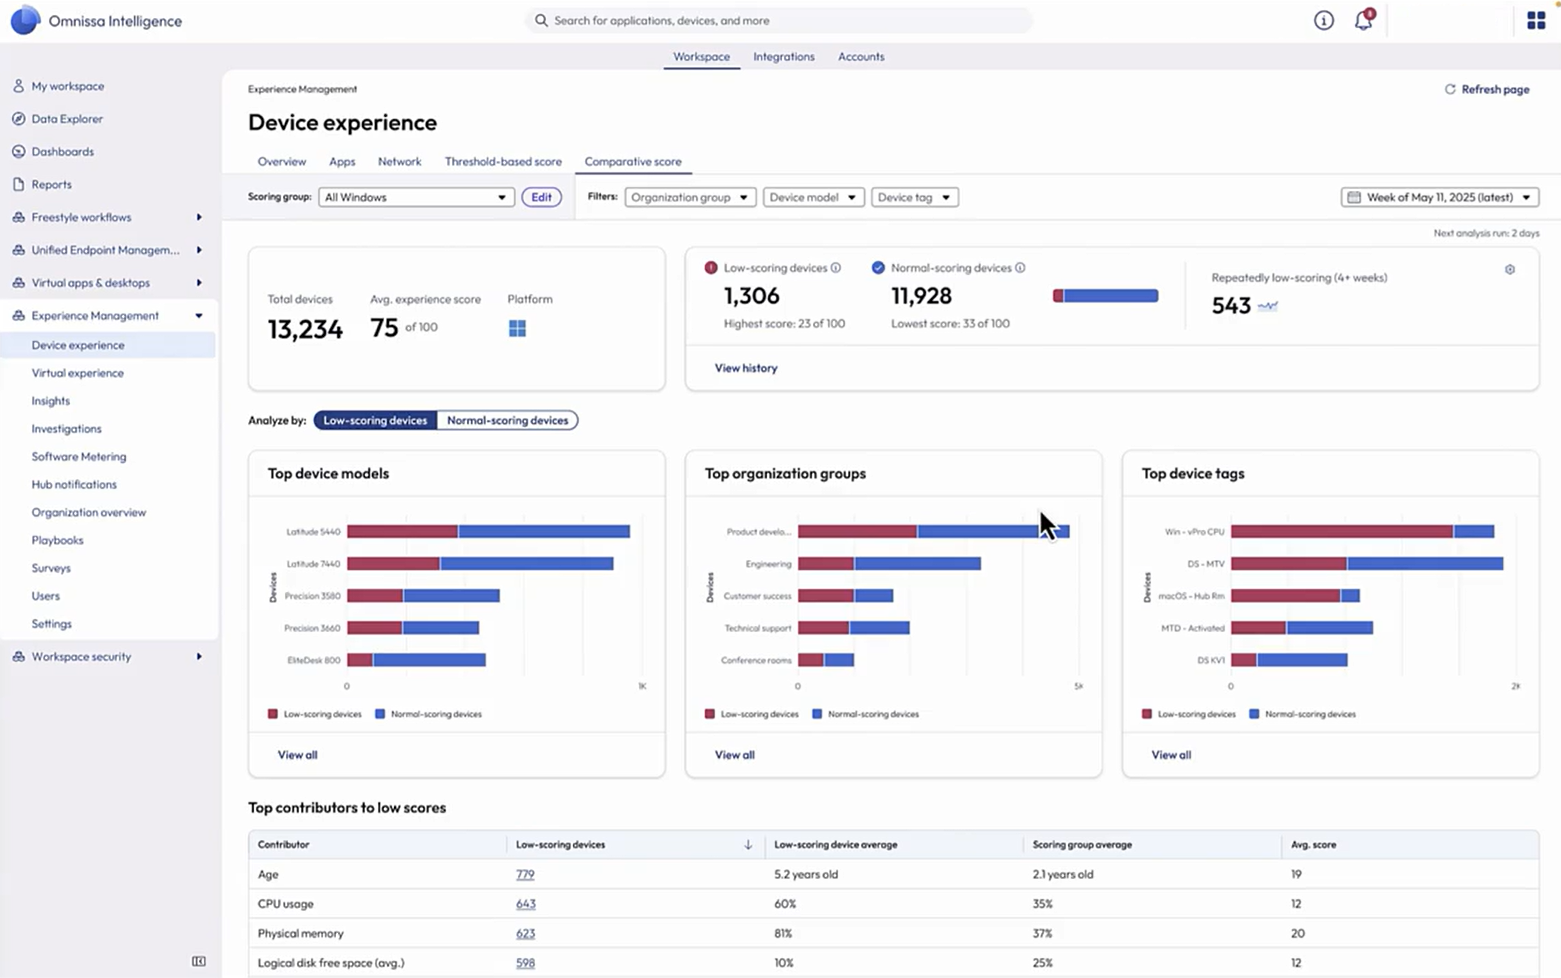
- The ML-based model generates a 0–100 score per device each week based on how the device's metrics compare to the scoring group baseline.
- Contextual scoring, unlike threshold-based scoring (for example, CPU < 60% = good), learns your organization's normal behavior and flags devices that deviate from peers.
- The scoring groups component runs on a configurable fleet segment or persona. Each group needs 500+ devices and one week of data minimum.
- Metric inputs and weights accept device, app, and network metrics as inputs. Assign higher weights to metrics that matter most to your organization when you configure scoring groups.
- Weekly refreshes update as you would expect, weekly. The Next analysis run indicator shows the scheduled refresh date.
What is Data Sufficiency?
Data sufficiency determines whether a device has enough telemetry to receive a score in a given week. Two conditions must be met to have data sufficiency.
- Scoring group level: A minimum of 500 devices and at least one week of data are required per scoring group.
- Device level: A device must report data in a minimum of 24 distinct hours over the last 7 days to receive a score.
- Devices that do not meet this threshold are excluded from scoring for that week.
- The 24-hour minimum is the default and can be adjusted per scoring group.
- The 7-day window is fixed and cannot be modified.
Data sufficiency checks are handled automatically. No manual configuration is required beyond optionally adjusting the device-level hour threshold in scoring group settings.
Filter out devices that are not scored
You can filter out devices that are not scored by using the following condition, Device scoring category = ‘NOT_SCORED’.
Device Experience Score Algorithm
The Device Experience Score feature compares each device’s metrics against others in its scoring group; devices in the same organization, platform, and fleet segment. A device is flagged as low scoring only when it performs significantly worse than its peers, not against a fixed industry threshold.
Each device receives a score from 0 to 100.
- A score of 100 means the device is performing as well as or better than its peers.
- Scores decrease as a device deviates further from the group baseline.
- The overall device score reflects its worst-performing metric.
- If one metric is severely underperforming, that drives the device score down even if all other metrics are healthy.
Devices are classified as Low-scoring or Normal-scoring based on a configurable threshold per scoring group.
How does Omnissa measure scoring quality?
The scoring model does not rely on fixed pass or fail thresholds, which means its quality cannot be measured by traditional accuracy metrics alone. Instead, confidence in a device’s score increases with the number of metrics that are independently flagged as underperforming. If multiple metrics on the same device show high deviation from the group baseline, that convergence is a strong signal that the device is genuinely experiencing issues, which reduces the likelihood of a false positive.
The Device Critical Feature Name and Device Critical Score fields identify the single metric most responsible for a device’s score in each scoring window, giving you a direct starting point for investigation.
Benefits and use cases
Benefits
Use the improved ML model for scoring device experiences for the listed benefits.
- Identify low-scoring devices across your fleet before users report issues.
- Understand top contributors to poor performance - device age, CPU usage, memory, and disk health.
- Analyze patterns across device models, organization groups, and device tags.
- Track devices with persistently poor scores over four or more consecutive weeks.
- Prioritize devices for hardware refresh or replacement based on peer-relative scoring data.
- Reduce support tickets by shifting from reactive troubleshooting to proactive detection.
- Build custom reports, widgets, and workflows using the Relative Experience Score Data definitions.
Use cases
Use Device Experience Score to drive several IT ROI outcomes.
- Proactive remediation:
- Fix problems before the help desk rings.
- Surface degrading devices before employees open support tickets, using score trends and critical feature flags.
- Outcome: Fewer tickets, faster resolution, better productivity scores.
- Device refresh ROI
- Replace fewer devices, spend less, prove it.
- Compare score-flagged replacements against an age-only replacement policy each month.
- ROI formula: (Age-based replacement count − Score-based replacement count) × average device cost = savings.
- Device right-sizing
- Standardize on what actually performs.
- Score devices by model and hardware spec to eliminate underperformers and standardize procurement on models that consistently score highest.
- Outcome: Better employee experience at the same or lower cost per device.
Requirements
To use the Device Experience Score feature, you must use the Omnissa Intelligence service with a license for Experience Management. See the Workspace ONE Editions on the Omnissa site for details.
Supported platforms
Device Experience Score displays metrics for Windows and macOS devices.
Navigation
Find the Device Experience Score feature in the Omnissa Intelligence UI at Workspace > Experience Management > Device experience. 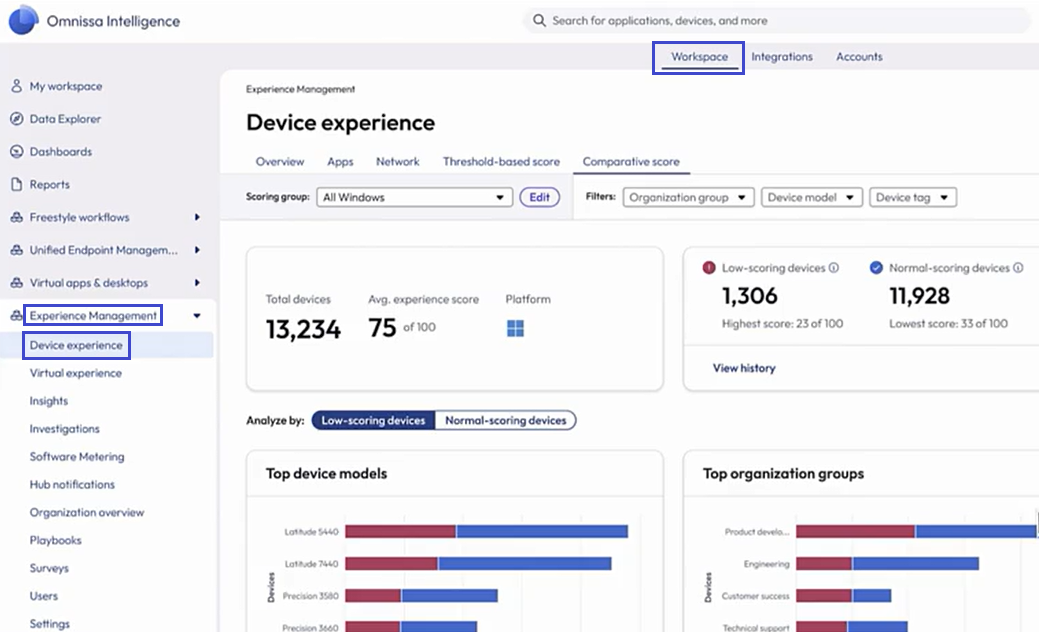
Understanding the dashboard
Let's look at the Device experience dashboard and review the available information.
Overview
The Overview tab shows fleet-wide scoring health for the selected scoring group and time period. Find the listed metrics.
| Metric | Description |
|---|---|
| Total devices | All managed devices in the selected scoring group. |
| Avg experience score | Fleet-wide average score on a 0–100 scale. |
| Low-scoring devices | Devices flagged as slow relative to the org baseline; shows highest and lowest score in the cohort. |
| Normal-scoring devices | Devices performing within the expected range. |
| Repeatedly low-scoring (4+ weeks) | Devices with a sustained low score for 4+ consecutive weeks — highest priority for action. |
| Next analysis run | Scheduled date of the next ML model refresh. |
Scoring groups and filters
- Scoring group: Select the device population to analyze. Select Edit to modify membership or metric weights.
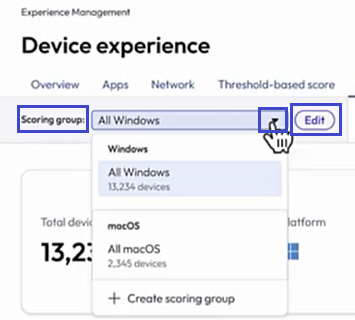
- Filters: Select Organization group, Device model, or Device tag to narrow results by these dimensions.

- Date: Select a specific week to analyze. The latest indicator marks the most recent completed analysis. The UI also reports when the next analysis runs.
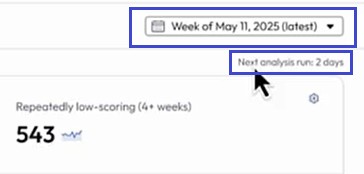
Analyze by toggle
Use the Analyze by toggle to switch all panels between cohorts. 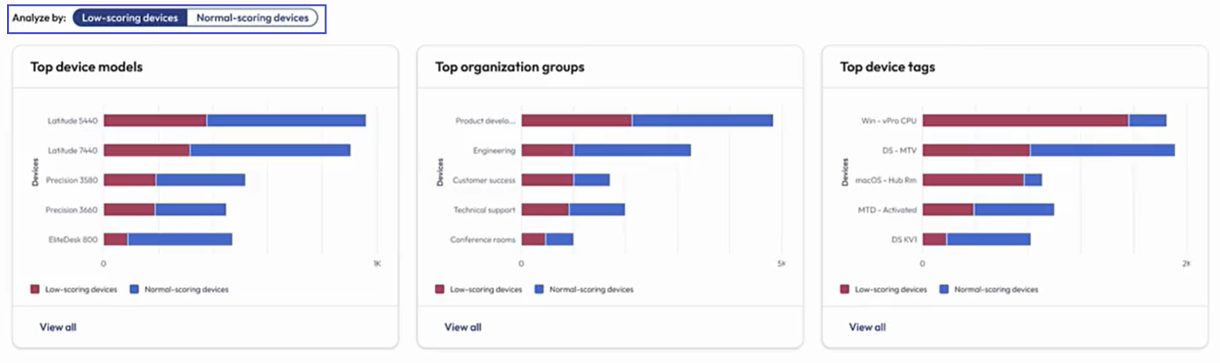
- Low-scoring devices: This filter displays the top device models, organization groups, and tags with the most slow devices. Panels display red bars.
- Normal-scoring devices: This filter displays the best-performing segments; panels re-label to the best device models with blue bars.
Top contributors to low scores
Find the Top contributors to low scores table below the breakdown panels. This table shows which metrics drive the most low scores across your fleet. 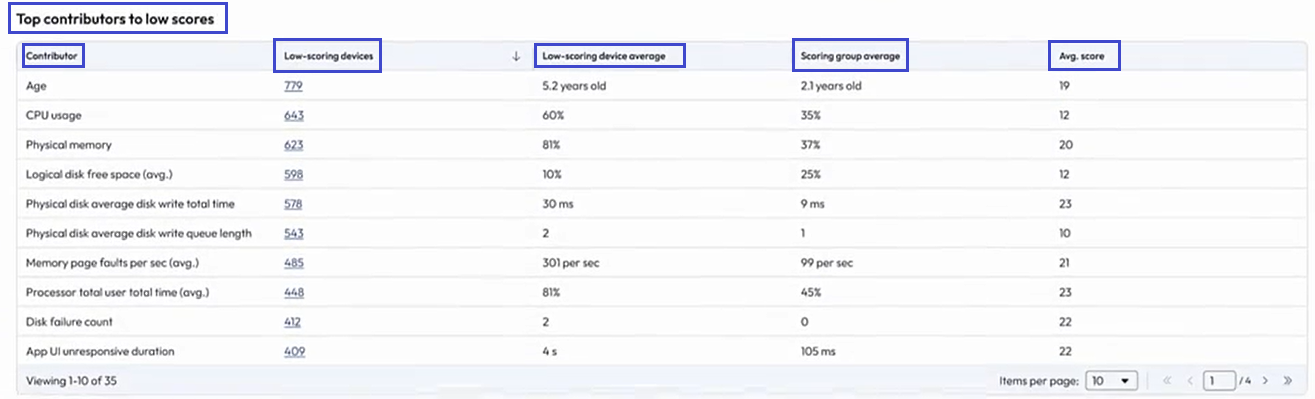
| Column | Description |
|---|---|
| Contributor | The metric name, for example age, CPU usage, or physical memory. |
| Low-scoring devices | The count of affected devices that you select to open the contributor detail page. |
| Low-scoring device average | The average metric value across the low-scoring cohort. |
| Scoring group average | The baseline average across all devices in the scoring group. |
| Avg. score | The average score of devices impacted by this contributor. |
Low-scoring devices
The Low-scoring devices table lists all low-scoring devices with their score and weeks marked low in the last three months.
Use the Minimum low-scoring weeks filter to focus on persistent issues. Select Create investigation or Run quickflow to act on selected devices. 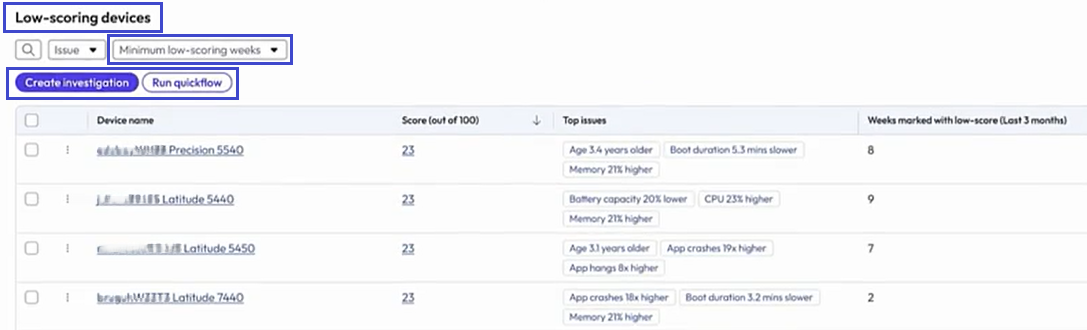
Find low scoring contributor metrics
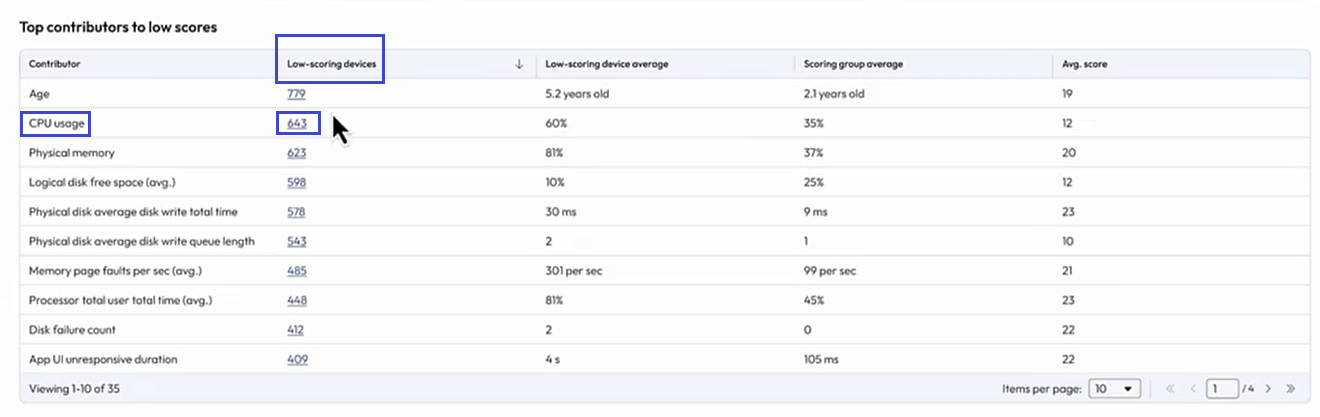
Select a device count in the Top contributors to low scores table to open the detail page for that metric.
- Go to Workspace > Experience Management > Device experience.
- On the Overview tab, scroll down to the Top contributors to low scores table.
- Select the count next located in the Low-scoring devices column next to the applicable contributor.
For example, select 643 next to CPU usage.
- In the contributor details, compare the low-scoring average usage to the normal-scoring average usage.
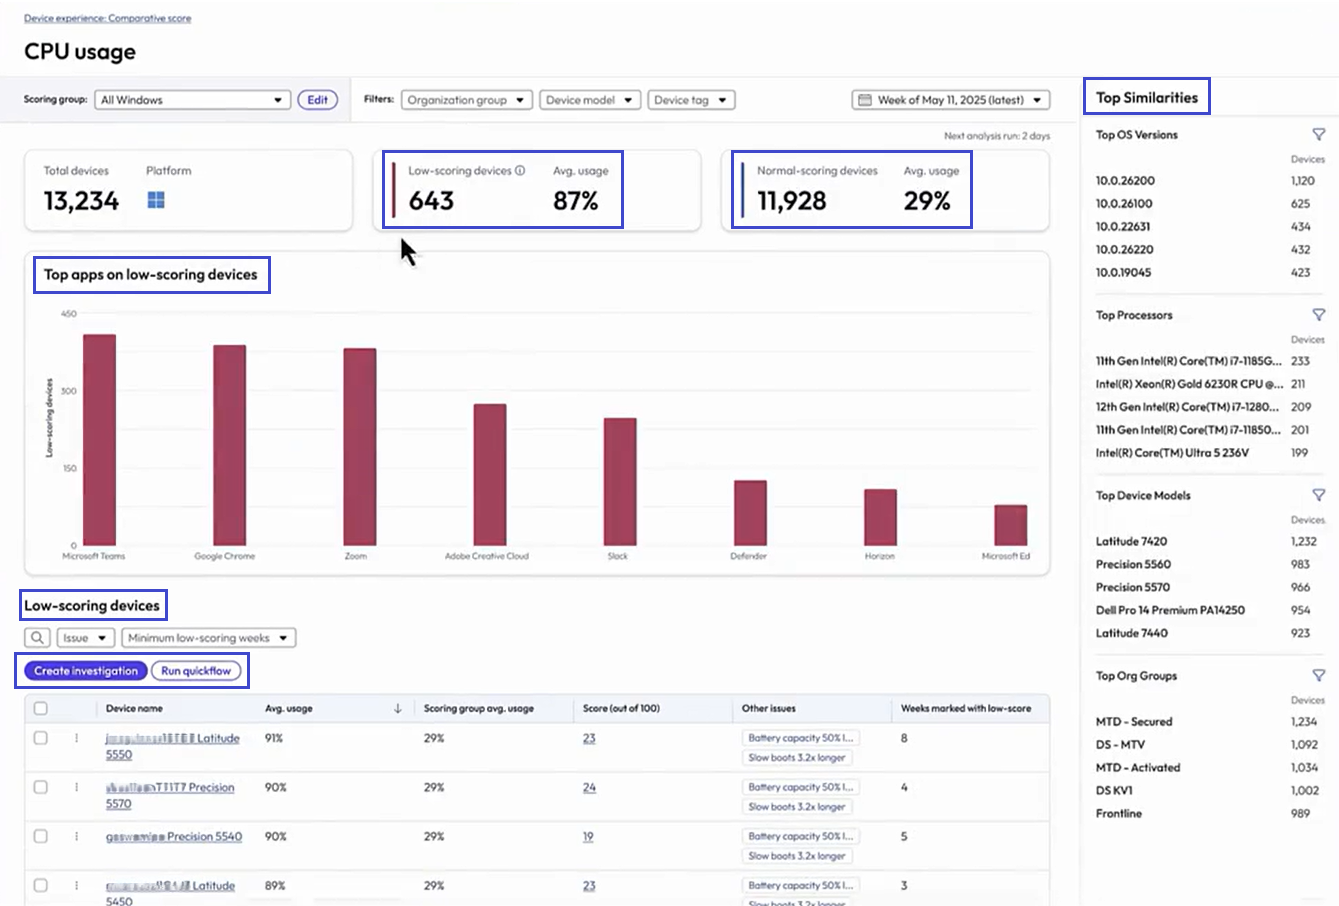
- Review Top apps impacting low scores to see which apps are driving the metric on low-scoring devices.
- Review the Top Similarities panel on the right for shared attributes, such as OS versions, processors, device models, and organization groups.
- In the Low-scoring devices table, select devices using the checkbox to the left of the device and use Create investigation or Run quickflow to remediate. You can also select the Device name to uncover more data specific to the device.
View device details
Select a device or device score in the dashboard to open its detailed panel.
- Go to Workspace > Experience Management > Device experience.
- On the Overview tab, scroll down to the Low-scoring devices table.
- Review the experience score, the device's top issues, and the weeks it was marked with a low score.
- Select a device's score to open a panel to the right with details contributing to the score.
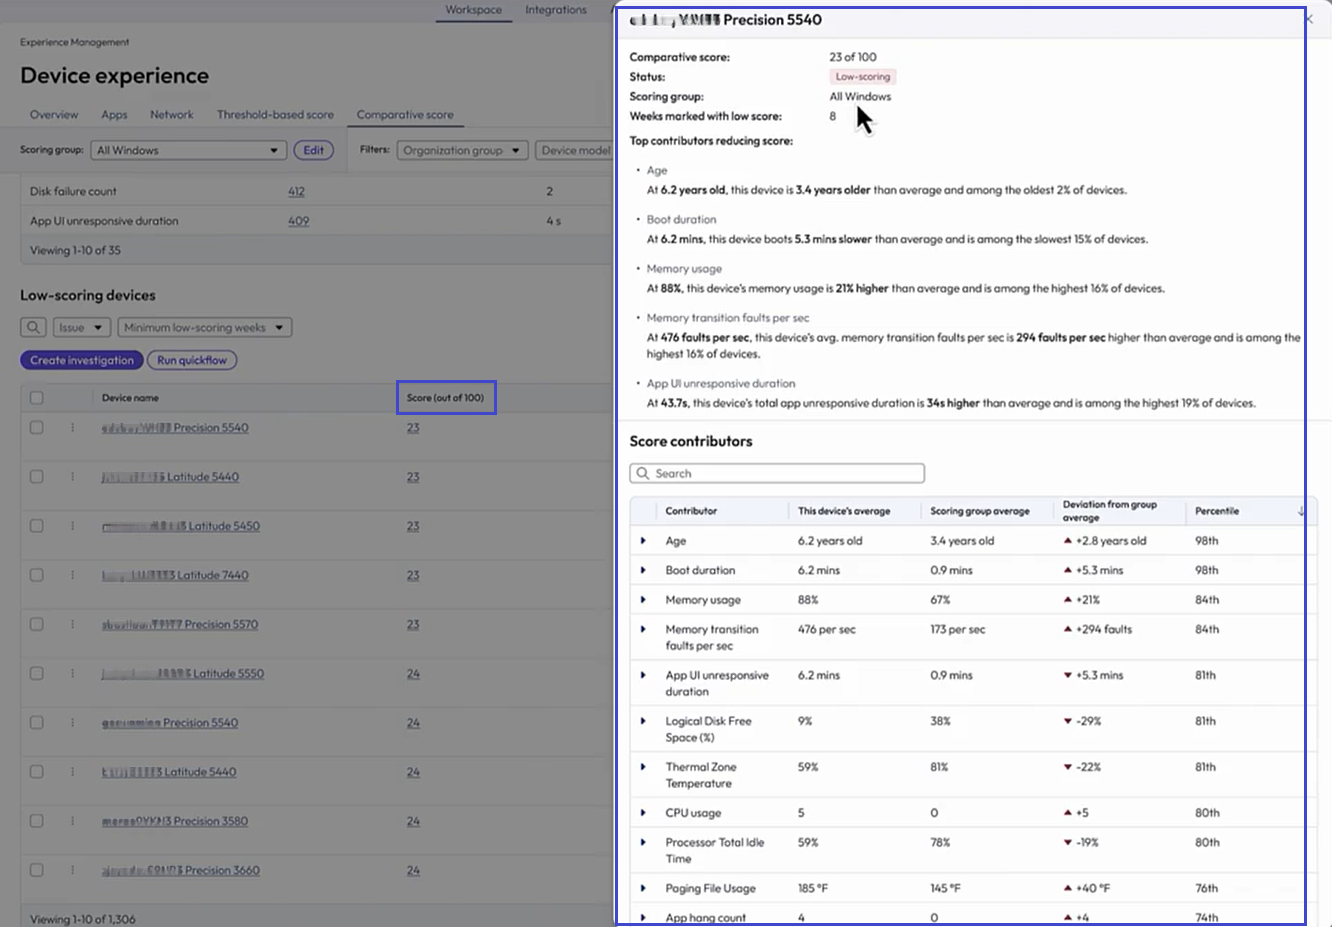
- Review top contributors reducing score.
- Each entry explains in plain language how the device compares to the scoring group average.
- Review the score contributors table for the full metric breakdown.
- This device's average - The device's average value for this metric.
- Scoring group average - The scoring group baseline for this metric.
- Deviation from group average - How far this device deviates from the baseline (+ above, − below).
- Percentile - Where this device sits in the scoring group distribution.
- Take action based on findings.
- For software or configuration issues, select Create investigation or Run quickflow.
- For aging or degraded hardware, initiate a refresh or replacement decision.
- Prioritize devices in the Repeatedly low-scoring (4+ weeks) cohort for immediate action.
Create a scoring group
Scoring groups define the device population used to compute peer-relative scores. Scores are calculated independently per scoring group, so a device is always compared against similar devices in the same group.
- Scoring groups are platform-specific.
- Windows and macOS devices must be in separate groups.
- Each device can belong to only one scoring group.
- Go to Workspace > Experience Management > Device experience.
- On the Overview tab, select the Scoring group drop down and select Create scoring group.
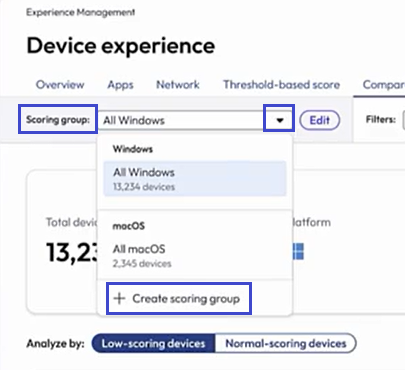
- Enter a name, select a platform (Windows or macOS), and select the devices to include using entries for organization groups, device models, and device tags.
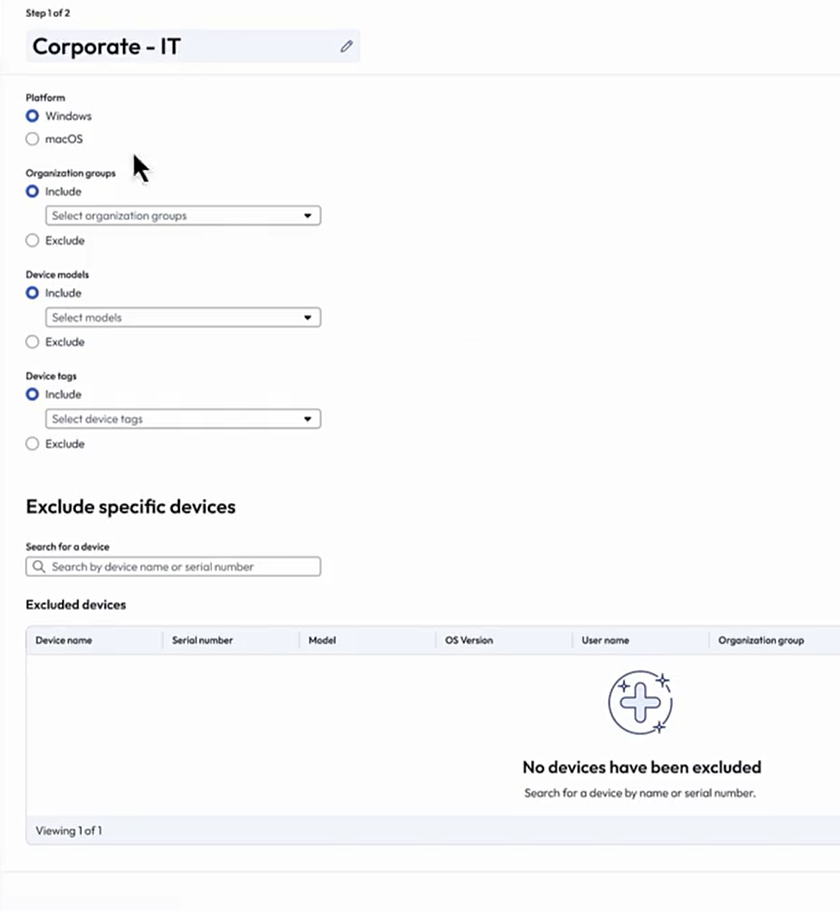
- You can exclude devices to remove specific devices from a scoring run without removing them from the organization group.
- Select Next to configure the scoring model.
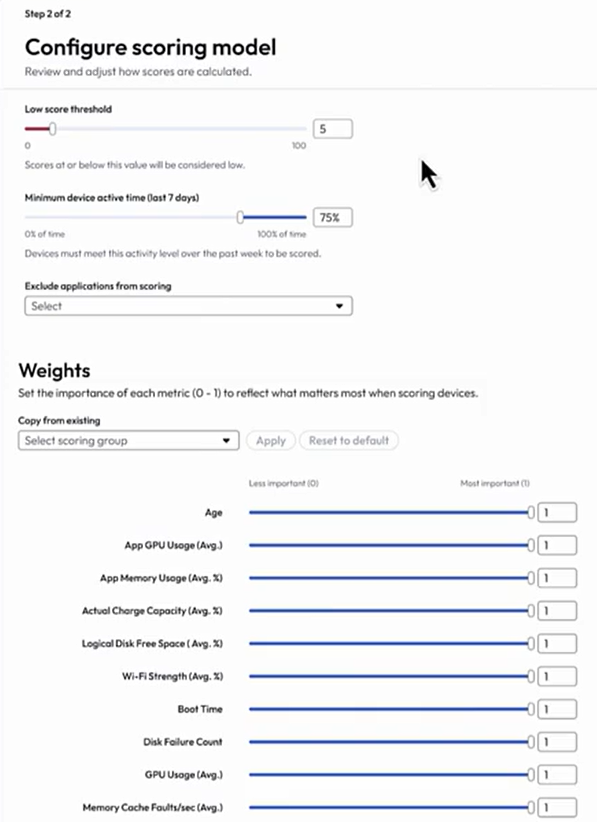
- Enter the Low score threshold.
- Set the Minimum device active time to configure the data sufficiency threshold as the minimum number of hours a device must report data (within the last 7 days) to be included in scoring. The default is 24 hours.
- Exclude apps to remove specific applications from contributing to app-level metrics (crash, hang, unresponsive) in the scoring model.
- In the Weights area, adjust how much each metric contributes to the device score. Increase the weight of metrics that matter most to your organization.
- Save your settings.
After saving a scoring group, the system confirms the group and shows when results will be available. The time frame for availability is typically within the following week after the system collects sufficient data.
Edit a scoring group
- Go to Workspace > Experience Management > Device experience.
- On the Overview tab, select the scoring group you want to edit in the Scoring group drop down menu option, and then select Edit.
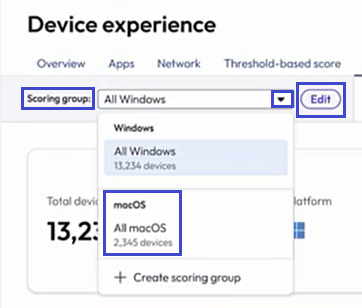
- Make your edits and save your settings.
After editing a scoring group, the next scheduled run applies your updated configuration.
You can also customize the peer group dynamically from within a device’s score view by selecting a new subset of devices or a single device. All baseline and percentile calculations update accordingly.
Windows versus macOS attributes
Device Experience Score supports both Windows and macOS devices. While most metrics are available on both platforms, some attributes are platform-specific. Device age is sourced from warranty integrations with Dell, HP, Lenovo, and Apple Business Manager. For macOS devices, device age is derived from the Apple Warranty API. Device age is used as a scoring input to help you factor hardware lifecycle into refresh decisions.
Data schema
Device Experience Score data is available as the Relative Device Experience Score entity under the Intelligence integration. Use this entity to build custom reports, widgets, and workflows based on scoring data.
| Field | Type | Description |
|---|---|---|
| device_id | String | Unique device identifier. |
| experience_score | Integer | ML-based peer-relative score (0–100). |
| scoring_group | String | Scoring group the device belongs to. |
| score_status | String | Low-scoring or Normal-scoring. |
| weeks_low_score | Integer | Consecutive weeks the device has held a low score. |
| top_contributor | String | Metric most responsible for the low score. |
Data definitions
Find the data definitions for this feature at Peer-based Device Experience Score.
Data Access Policies (DAP)
The Device Experience Score feature respects your organization's existing Data Access Policy (DAP) automatically. You don't need to configure a separate filter for scoring data. Omnissa Intelligence applies your DAP scope to the dashboard for you.
When you open the Device experience dashboard, Intelligence automatically filters devices, scores, and metrics to only the devices your DAP permits you to see. This scoping is based on the organization groups configured in Workspace ONE UEM.
What changed from the legacy, threshold-based scoring?
- The legacy scoring method calculated app metrics at the app level, so DAP-restricted admins couldn't isolate app-driven issues (crashes, hangs, unresponsive duration) to just their own devices.
- The app score reflected all devices, not only the ones in scope.
- The Device Experience Score feature calculates these metrics at the device level, so a DAP-restricted admin now sees app issues scoped to only the devices they're permitted to view.
Other documentation resources
- See the topic Investigations for details on how you can track, collaborate, and perform root cause analysis (RCA) within your Omnissa Workspace ONE Experience Management solution.
- See the topic Quickflows for details on how you can run on-demand workflows on selected targets.
- See the topic DAP for details on how to control what data certain users see in dashboards and reports.
Was this page helpful?