Omnissa Workspace ONE® Experience Management helps organizations gain insights into employee experiences through their digital workspaces. Experience Management provides insights about apps, operating system stability, and performance. It also displays analytics for key performance indicators that impact employee experiences such as start time, shutdown time, logon, and logout events.
What is Experience Management?
Experience Management harvests telemetry from desktop and virtual devices and provides insights to take predictive actions. The Experience Management agent in the Omnissa Workspace ONE Intelligent Hub or in the Horizon Client, or the separate Experience Management agent collects telemetry data and sends it to Omnissa Intelligence for display and interaction in dashboards, reports, and workflows.
Requirements
- General requirements
- Use the minimum supported version of the Omnissa Workspace ONE UEM console.
- Use corporate-owned and corporate-shared devices because the system does not collect data from BYOD devices.
- Use the Omnissa Intelligence service with a license for Experience Management.
- Setup and activate the Experience Management solution in Intelligence.
- If devices are behind a proxy server, allowlist certificate revocation checking URLs.
- If you do not allowlist the URLs needed for certificate revocation checking, the Experience Management agent on the device cannot communicate with Intelligence, and in turn, Intelligence cannot display Experience Management data.
- Deploy the Experience Management agent to devices.
- There is a macOS agent and a Windows and Horizon agent.
- Find the agent on Customer Connect.
- Windows
- Use the version of Workspace ONE Intelligent Hub for Windows that aligns with the minimum supported version of Workspace ONE UEM.
- Use Windows devices that are either managed in Workspace ONE UEM or managed by another EMM solution (Hub Registered Mode).
- For Windows devices in Hub Registered Mode:
- Configure Hub Registered Mode in Workspace ONE UEM.
- Ensure that your devices are managed by another EMM solution.
- macOS
- Use macOS devices that are either managed in Workspace ONE UEM or managed by another EMM solution (Hub Registered Mode).
- For macOS devices in Hub Registered Mode:
- Configure Hub Registered Mode in Workspace ONE UEM.
- Ensure that your devices are managed by another EMM solution.
- For UEM-managed macOS devices, use the Workspace ONE Admin Assistant for macOS.
- Use the version of Workspace ONE Intelligent Hub for macOS that aligns with the minimum supported version of Workspace ONE UEM.
Trials
If you are interested in trying Experience Management using a trial, see the topic Trial versions to find out how to activate a trial for 30 days.
Setup Experience Management and view Experience Scores
You can configure Experience Management in the Solutions area of Intelligence. You must have Administrator and Analyst permissions to setup the feature.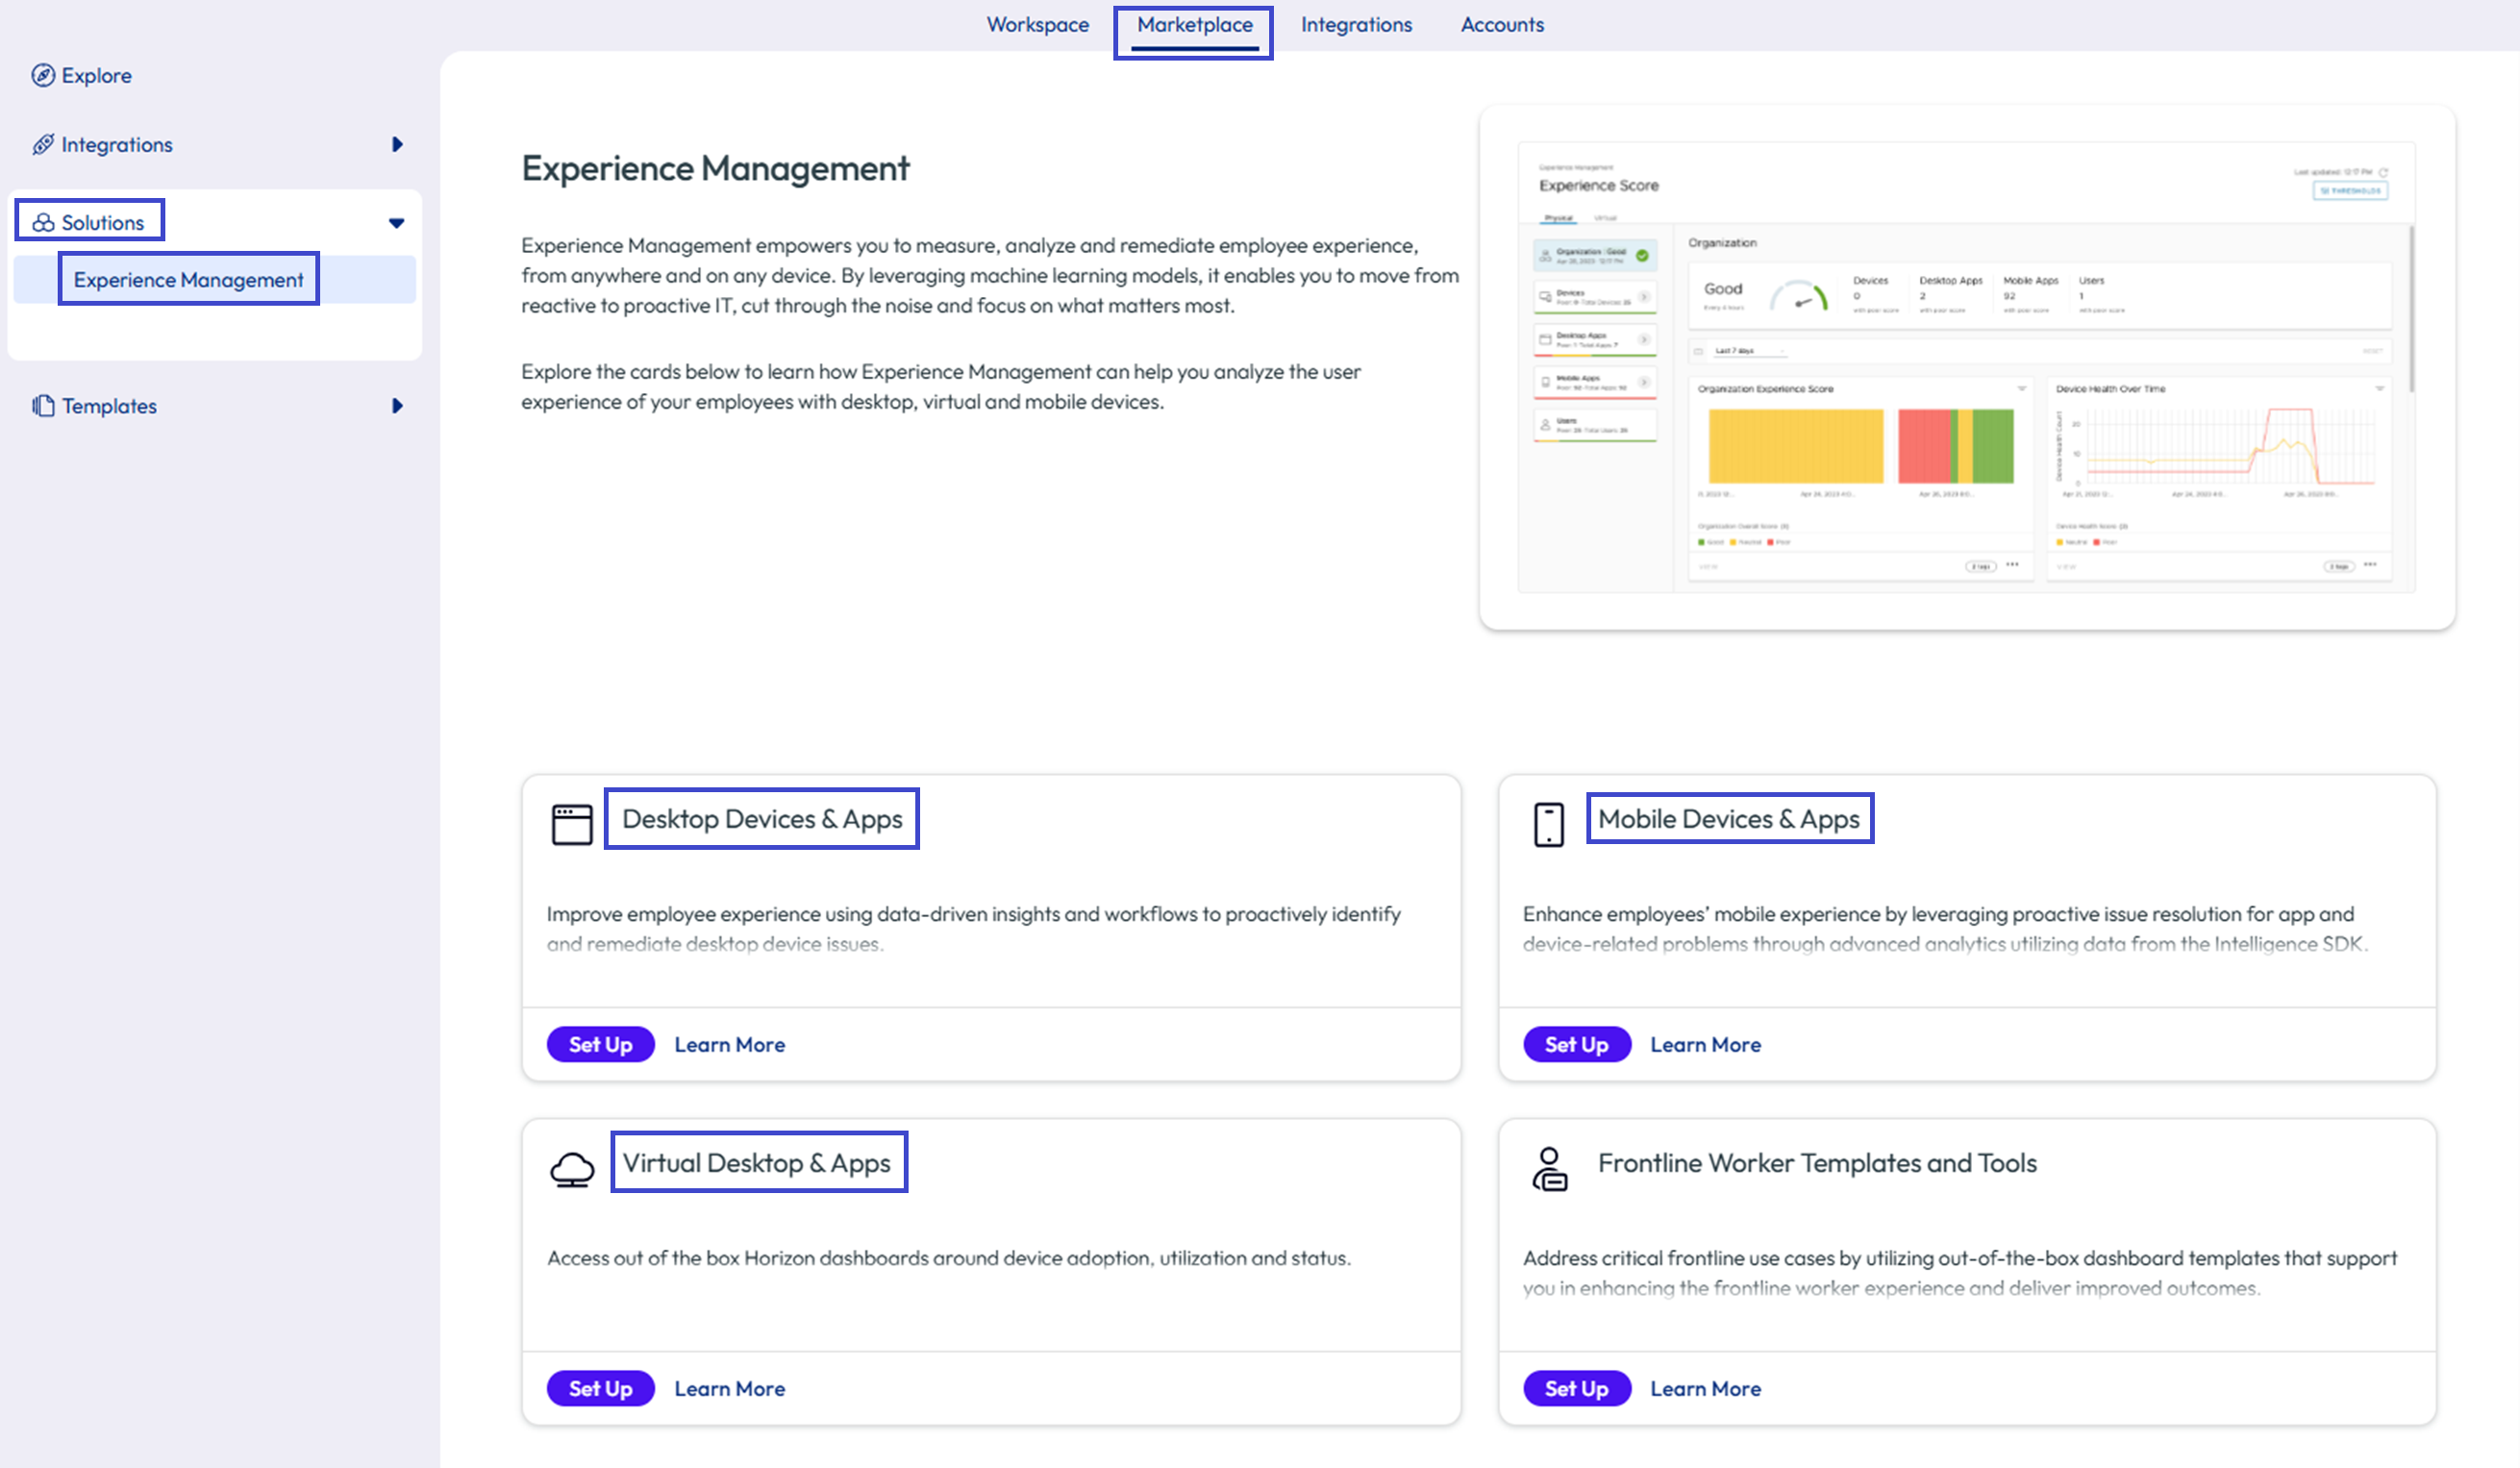
- In Intelligence, select Marketplace > Solutions > Experience Management.
- Select a tile for setup.
- Desktop Devices & Apps - This menu option includes using the Intelligent Hub to gather data in your Omnissa Workspace ONE UEM Integration to help measure, analyze, and remediate your UEM-managed resources.
- Mobile Devices & Apps - This menu option includes Mobile Analytics Data for the Intelligence SDK, which displays mobile analytics (Mobile DEX) data for your apps and devices that use the Intelligence SDK.
- Virtual Desktops & Apps - This menu option includes Experience Management for Horizon data to help with understanding the overall experience of Horizon deployments and to help take actions to improve or fix user experiences.
Note: Data does not immediately display after setup because it can take up to 4 hours for the system to calculate experience scores.
How do you find users to see their Experience Management telemetry?
Use the search feature (the magnifying glass) in the header of the UI to find users in your Experience Management solution. Select the drop-down menu and choose Users, and then enter various attributes to find the user.
- Username
- First name
- Last name
- Email address
Note: Searching with a combination of first and last name is not currently supported.
Select the user record from the search results to view the Experience Management telemetry. The system displays information depending on the Omnissa services used by the user.
- If the user is a Horizon user, the system navigates to the user's User Sessions information.
- If the user is a UEM user, the system navigates to the associated user dashboards. Find information about the devices they use, their risk scores, and the apps they use. Data is distributed on three tabs, the Overview, Experience, and Security tabs.
- Overview: The Overview tab displays the user's overall Experience Score, Risk Score, Associated Devices, and their experience and risk scores over time.
- Experience: The Experience tab breaks down the user experience score by Device Health, Desktop Apps, and Mobile Apps (those that include the Intelligence SDK).
- The Device Health table lists the name of the user's device (with a link to device specific information) and gives device data about OS Crashes, Boot Time, Shutdown Time, and Battery Health. This data explains why Device Health is Good, Neutral, or Poor.
- The Desktop Apps table lists up to 15 of the most used apps for the user based on app foreground time, along with the app's version, average crash rate, average app hangs, and experience score.
Note: The experience score for desktop apps reflects the app's score across the organization, not a score specific to the user. - The Mobile Apps table lists experience data for apps that use the Intelligence SDK.
- Security: The Security tab offers information about user risk over time and login information. If you use Carbon Black, this tab lists Carbon Black alerts for users.
Examples of how to find data by user
- You want to find a specific device for a user to troubleshoot a reported issue, and the device name is too complex to type into the search box.
- Search for the user based on username, first name, last name, or email address.
- Select the user from the results.
- Find the device in the device list view.
- Select the device name to navigate to the device timeline view and begin investigating.
- A user has been graded with a poor experience, and you want to know why.
- Search for the user based on username, first name, last name, or email address.
- Select the user from the results.
- Select View on the Experience widget or select the Experience tab.
- View device experience scores and most used apps to determine which are graded poorly. Poorly graded apps and device experiences cause the user's experience score to also be poor.
- Drill into the poorly graded device experiences and apps to investigate possible causes.
- You want to know when a user first began having a poor experience, and how long has the experience score been poor.
- Search for the user based on username, first name, last name, or email address.
- Select the user from the results.
- Scroll to view the Experience Score over time chart.
- If necessary, update the time range to determine when the user was first graded with a poor experience.
- Look for changes with the user's devices or apps at the time of the experience score change to understand the root cause.
Where can you access Experience Management telemetry data?
Access your Experience Management telemetry data in the Workspace > Experience Management area.
- Use the Experience Score dashboard to see scores for desktop apps, mobile apps, and device health on the Physical tab. You can view Horizon scores if you have setup the Virtual Desktops & Apps feature using the Virtual tab.
- After you have setup Experience Management, you can navigate to your telemetry data using Marketplace > Solutions > Experience Management, and select a feature to View in Workspace.
Import Experience Management dashboard templates
You can import Experience Management dashboard templates from the Marketplace tab. For dashboard templates, use the Integrations filter for Employee Experience.
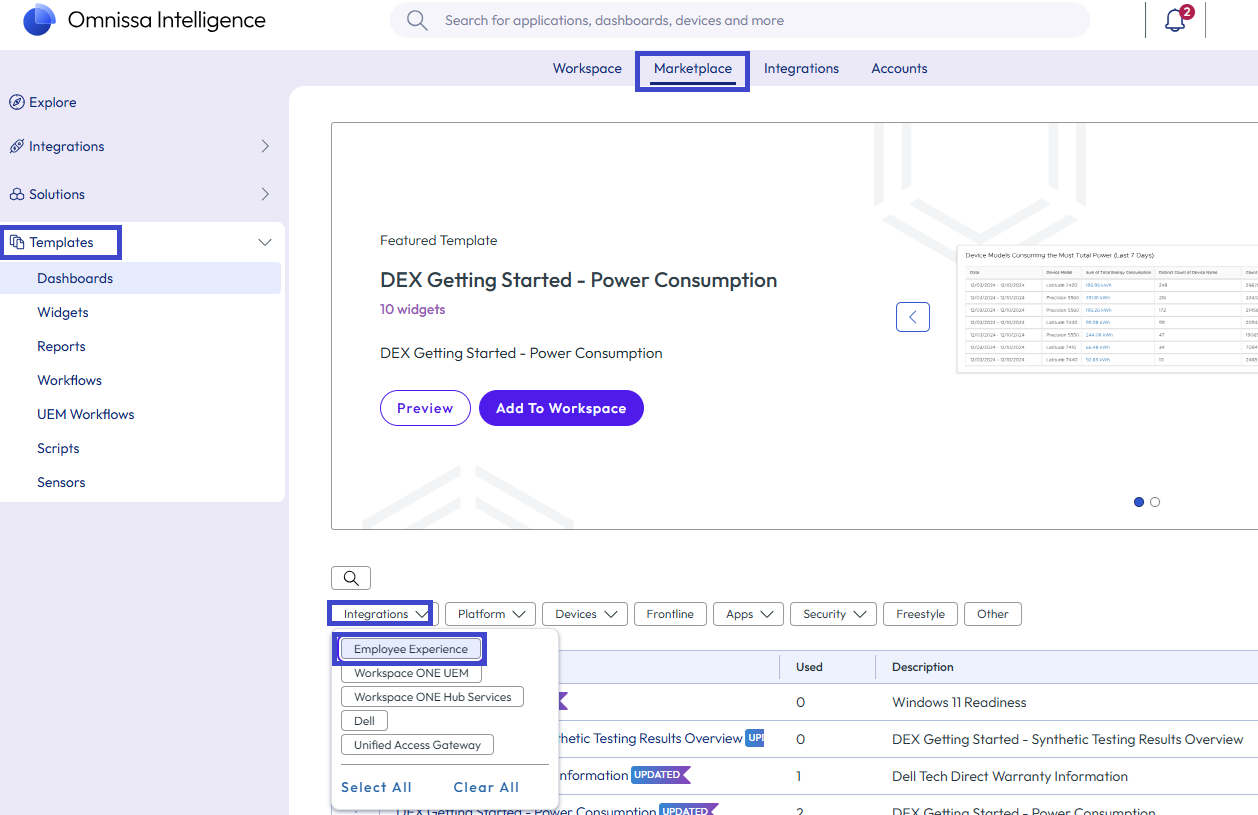
Another way to get Experience Management templates is to download sample code from the Omnissa Developer Portal Code Samples.
To import a dashboard template in Omnissa Intelligence, go to Workspace > My Workspace > Recent Dashboards > View All > Add > Import Dashboard.
What data source identifies Experience Management data?
When working in widgets in Omnissa Intelligence, look for the Employee Experience data source.
What data does Experience Management provide?
The Experience Management system provides various telemetry.
- Organization Experience Score
- User Experience Score
- Desktop Apps Experience Score
- Mobile Apps Experience Score (for Intelligence SDK apps)
- Device Health
- Application Performance and Stability
- OS Crashes
- Login, and Logout
- Boot and Shutdown events and duration
- Windows Services Status
- Windows Performance Monitor Data
What is supported for third-party managed devices?
Collect Experience Management data from devices that are either managed by Workspace ONE UEM (UEM Managed) or that are managed by other EMM solutions (Hub Registered Mode). Whichever management solution chosen, you can benefit from Experience Management on Windows and macOS devices.
To cover a variety of use cases, Workspace ONE UEM provides four general options for device management.
- UEM Managed
- OS Partitioned
- Hub Registered Mode
- App Level Management
Resources
- UEM management modes
- For an explanation of management modes, access the Omnissa Tech Zone article Workspace ONE UEM Management Modes.
- Hub registered mode on Tech Zone
- Windows: For an overview of how to deploy Experience Management on Windows devices in Hub Registered Mode that are managed by a third-party solution, see the Omnissa Tech Zone article Omnissa DEX Solution for Third-Party Managed Windows Devices.
- macOS: For an overview of how to deploy Experience Management on macOS device in Hub Registered Mode that are managed by a third-party solution, see the Omnissa Tech Zone article Omnissa DEX solution for third-party managed macOS devices.
- UEM procedures
- Windows: See Enroll with Registered Mode for details on how to register a Windows device in UEM in Registered Mode.
- macOS: See Registered Mode for details on how to register a macOS device in UEM in Registered Mode.
What is the Experience Management footprint on your devices?
The footprint is comparatively small. The tested configurations for Experience Management suggest a periodic impact of up to 5% CPU usage for a typical 4 core CPU. Tested configurations also suggest 10 to 40 Mb of memory usage on each Windows or macOS device.
How often does Experience Management data update?
Experience Management telemetry data updates every 10 minutes.
Note: You cannot adjust the update frequency.
What are the sample and transmission frequencies?
The tables outline the sample and transmission frequencies for each component in the Experience Management solution. Consider the following list when viewing the entries for virtual, physical, and mobile (Intelligence SDK) data sources.
- The Experience Management agent sends most data every 10 minutes at a maximum of 5 MB to Omnissa Intelligence.
- The Experience Management agent sends events to Intelligence for App Crashes, App Launches, App Updates, Boot Times, and Logon events immediately when the events happen. However, Intelligence has various processing times, so you can use the timestamp for an event (Last Sync Time) as the time the event occurred.
- The Experience Management agent sends OS Crash events after reboots upon the OS initiating.
Note: You cannot adjust the sample or transmission frequencies.
Virtual
| Data Source | Data Type | Examples | Sample Frequency | Transmission Frequency |
|---|---|---|---|---|
| Experience Management Agent | Issues/Events | App Crashes/Hang/Foreground/User GPO | Real-time | 10 minutes |
| Experience Management Agent | App performance data | App CPU/MEM/Disk | 10 seconds | 10 minutes |
| Horizon Agent | Performance data | VM CPU/MEM/Disk/Protocol Latency | 1 minute | Immediately |
| Experience Management Agent in Horizon Client | Net event | Wi-Fi Signal Strength | 10 minutes | 10 minutes |
| Experience Management Agent in Horizon Client | Net event | LAN/WAN Latency | 10 minutes | 10 minutes by default |
| Intelligence Processed | Metrics | UX Scores | NA | 4 hours |
| Horizon Connection Server | Performance data and events | CPU/Memory/Session Count/SSL Certification Status/Status | 5 minutes | Immediately |
| UAG Appliance | Performance data and events | CPU/Memory/Connection Count/SSL Certification Status/Status | 5 minutes | Immediately |
Physical
| Data Source | Data Type | Examples | Sample Frequency | Transmission Frequency |
|---|---|---|---|---|
| Experience Management Agent | Issues/Events | App Crashes/Hang/Foreground | Real-time | 10 minutes |
| Experience Management Agent | App performance data | App CPU/MEM/Disk | 10 seconds | 10 minutes (averaging 60 samples) |
| Experience Management Agent | Device performance data | Device CPU/MEM/Disk | 5 minute | 10 minutes |
| Experience Management Agent | Device hardware | USB/PCI | 1 hour | 10 minutes |
| Intelligence Processed | Metrics | UX Scores | NA | Every 4 hours |
| Intelligence Processed | Metrics | App Activity/Device/Activity | NA | Every 24 hours |
Mobile
| Data Source | Data Type | Examples | Sample Frequency | Transmission Frequency |
|---|---|---|---|---|
| Intelligence SDK | Performance (device wide) | Battery/Device/Network | 10 minutes | 10 minutes |
| Intelligence SDK | Issues/Events (app specific) | App Crash/Hang/Handled Exceptions/Network Communications/Userflows | Real-time | Immediately after they happen |
| Intelligence Processed | Metrics | Crash Rates/User Flow Time to Completion/User Flow Failure Rate/Network Error Rate/Response Time/Handled Exceptions | NA | Every 4 hours |
Use Thresholds to find all the data attributes Experience Management uses
For the latest list of attributes, which can change often, use Omnissa Intelligence. Viewing the attributes in the console ensures you see the most current list.
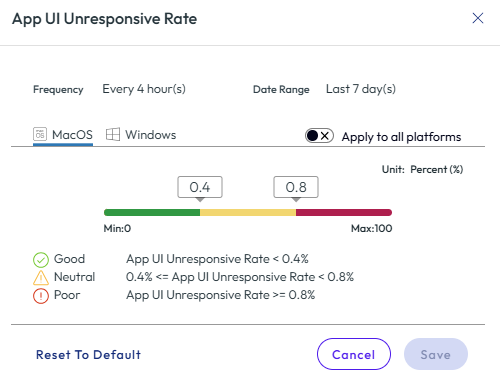
- Go to Workspace > Experience Management > Experience Score.
- Select View Thresholds.
- Scroll through the categories to see the attribute and its thresholds.
- You can select the attribute tile to see more information like its frequency and date range. From this tile, you can reset the threshold to the default and apply the threshold to other platforms.
Organization Overview page
Use the Organization Overview page to see all your Experience Management features at-a-glance. You can also find information concerning your ITSM Connector, Software Asset Management, Freestyle Workflows, and Frontline dashboards.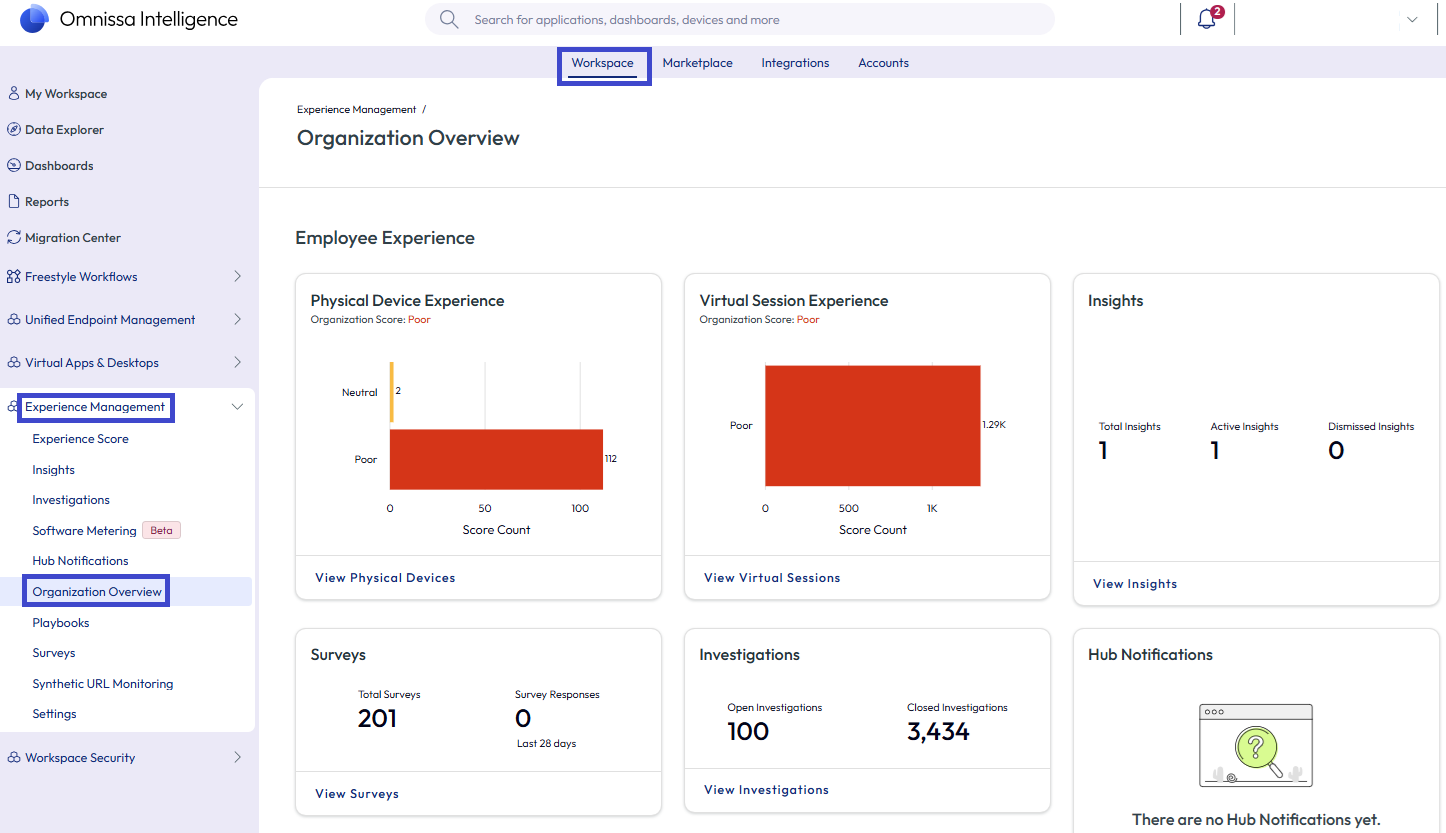
Find the page at Workspace > Experience Management > Organization Overview.
Data table display limits
Data tables in your dashboards, reports, and workflows have a display limit of 500 records or events (objects). Although an environment might have more than 500 objects, tables can still only display 500 objects.
Although the table display is limited to 500 objects, the widget that creates the table applies the rules, sorting, and filtering to all the data and then displays the first, matching 500 objects.
Was this page helpful?