Omnissa Workspace ONE Experience Management for Horizon offers User Session Timelines to help you monitor and troubleshoot your Horizon user experiences. Available telemetry includes CPU, memory, application performance, and virtual machine (VM) and Horizon Client network data grouped by pools and farms and displayed over customizable time ranges.
Required subscriptions and components
- Have the Workspace ONE Experience Management for Horizon subscription.
- Use the Experience Management for Horizon agent v24.12 or later.
- Use Horizon 2412 or later components for Connection Server and Horizon Agents.
Supported platforms
Experience Management for Horizon works for the Windows platform.
Use cases
User session timelines can help with the listed Support and Service Desk use cases.
- Search for and find a Horizon user in seconds.
- Customize the order of event data based on the cause.
- Summarize a user's issues with CPU, memory, application performance, and VM and Horizon Client networks. View the issues within seconds to troubleshoot why the user is having a bad experience.
- Quickly filter all occurrences of a user issue to view them in an event log.
Navigation
Use the Search feature to enter Horizon user names and find their user session information fast.
- At the top of the Intelligence UI, place your curser in the Search text field.
- Select the User tab and enter two characters of the user's name.
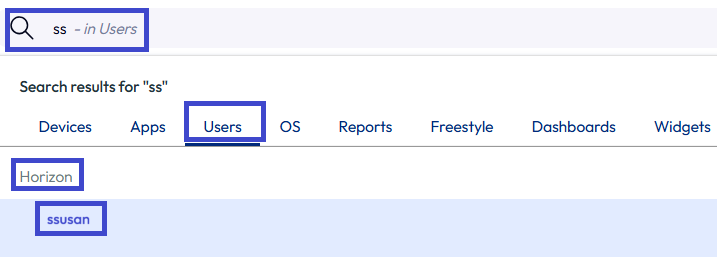
- Look for the Horizon header.
- Select the user to access their User Session timeline.
User session tabs
When you navigate to the a user session timeline, access information on the tabs to help research and troubleshoot events.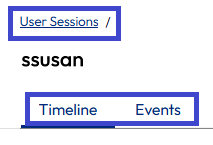
Timeline
Use this tab for predefined views that visualize events. Also, create customized Saved views that you can use to meet your researching activities.
- The views you save persist and you can manage them.
- Add telemetry contributor rows for Sessions and Apps in a pool or farm section.
- Add more metrics to rows in pool or farm sections.
- Customize the date range to see issue details.
- Select a time interval to aggregate the timeline data.

- Interval options are automatically updated based on time range and date range selection.
- By default, the system selects the Interval for the lowest available data aggregation. This selections gives the timeline the highest data fidelity for the selected time or date range.
- Select a time interval to aggregate the timeline data.
- Interact with data by hovering over data points.
- Select data points in the CPU and Memory contributor rows to see details concerning these events.
Events
Use this tab to see a list of issues as a report or quick reference during research.
- Use the Filters to customize the list and to display data specific to your research.
- Events in this log are specific to Experience Management for Horizon and are not associated with other Omnissa products at this time.
Interact with data
Interact with data in a user session using the widget components. Use the Saved Views area to display data according to views. Within the view, the system groups contributors by pool or farm. You can organize the telemetry contributor rows in the pool and farm sections to match your research style. Also, access more details for CPU and Memory contributors by selecting data points in these rows.
Network connectivity map views
Use the network connectivity map view to get a visual line of site to a user's connectivity from the Horizon Client to the virtual desktop.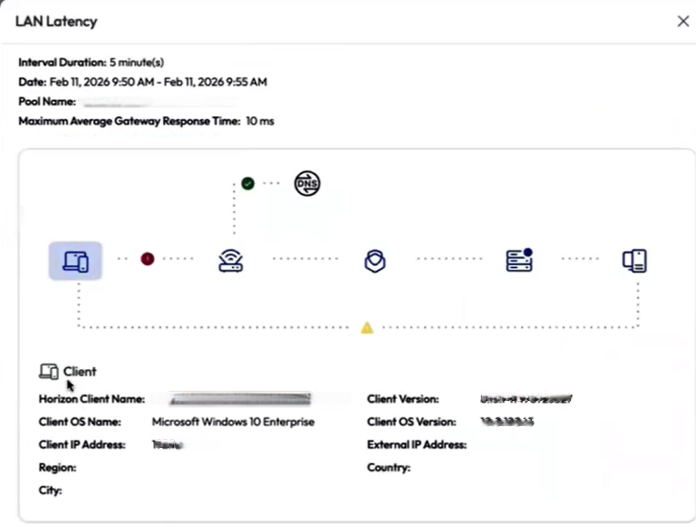
This view also offers information about the Unified Access Gateway, the Connection Server, and the applicable VM.
To access the view, work in a user session timeline.
- In the user session timeline, go to a network metric, like LAN Latency, and look for a red marker in the bar graph.
- Select the red bar, which is identifying poor LAN latency data, to display and expand the network connectivity map view in the right tray.
Saved views
- By default, a user session timeline opens using the Issues view.
- This view shows only telemetry that is in the Poor threshold category for the selected time range.
- This view does not display telemetry that falls within the Good or Neutral thresholds.
- To see a complete list of telemetry and top applications, regardless of threshold state, select the Overview tab.
- Other available views are Top Apps by CPU, Network, and Activities. See the Create a saved view section for details on creating your own views.
Pools and farms
- The system organizes data in these collapsible sections by the user’s session with the listed pool or farm.
- Each pool or farm section includes key telemetry sets including the VM use, the application resource use, the network and protocol, the activities and events, and the top 5 applications.
- Expand and collapse each pool or farm section. By default, the UI displays pools and farms as expanded.
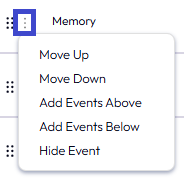
- Drag and drop the 6 dots on the telemetry contributor rows to order them.
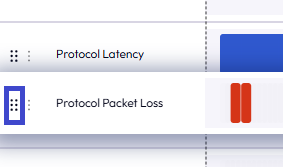
- Select the 3 dots (found next to the 6 dots) to move, add, remove, and hide telemetry. These actions are useful if you want a to put two telemetry contributor rows together for a side-by-side comparison.
Timeline and activities
Contributor rows within a pool or farm visualize data as telemetry data points over the selected time and date range.
- Timelines are illustrated using trend lines and block or dot indicators.
- Timeline colors change according to the threshold range.
- The blocks and dots are color coded to intensity, where light colors indicate a lower intensity or number.
- Get expanded details of a user session’s CPU and Memory telemetry.
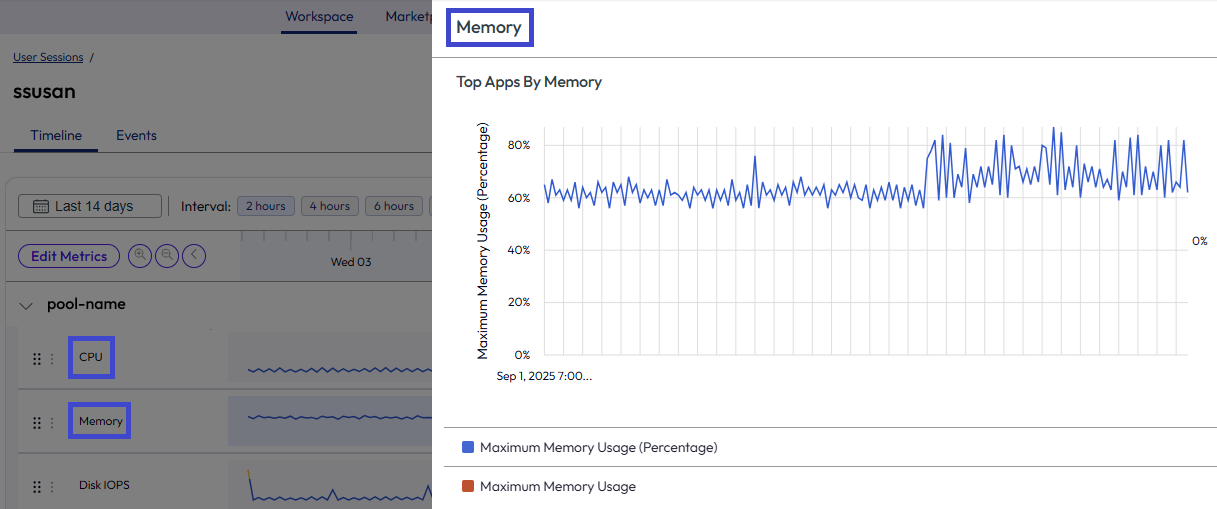
- Hover over and select a data point in the timeline of the CPU or Memory contributor.
- Selection opens a tray on the right side with details on different applications driving the session’s overall CPU and memory use.
- Not all telemetry contributors support the additional details page at this time.
Create a saved view
Use the Saved views options to customize the timeline to your research and troubleshooting workflow. If you are not sure how to start, use the Issues or Overview views as spring boards for research. If you know how you want contributors displayed, create your own layout for use in the Saved views area.
- In the Saved views area, select the three vertical dots to create a layout view.
- Select Create New View.
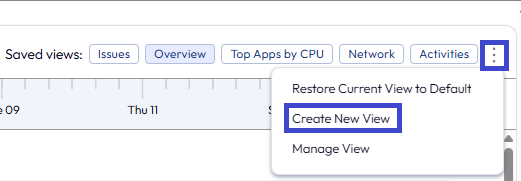
- Enter a name for the view. For example you can enter My Layout.
- Select what layout view to start with.
- Duplicate of the current view: This option uses the layout you are currently in.
- Blank view: This option uses a blank layout.
- Select Create.
- Select My Layout and then select Edit Metrics to add any Sessions or Apps data to your layout.
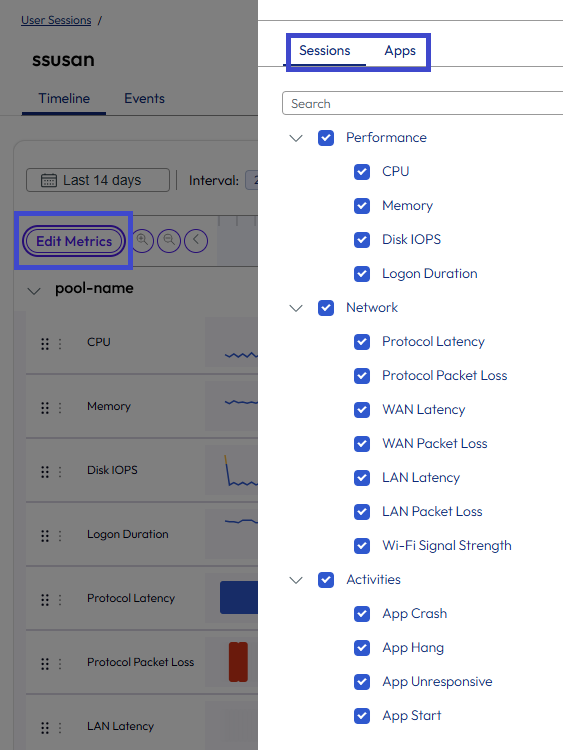
- You can drag and drop event rows and order them to fit your research. If you do change the order of event rows, you must save your changes to your view.
- Select the three vertical dots.
- Select Manage View to save your arrangement.
More documentation
See the referenced content for information on the related features.
- Thresholds: Access How do you control thresholds for Horizon telemetry for details on how to change default threshold values.
Was this page helpful?